One Hour One Life Forums
a multiplayer game of parenting and civilization building
You are not logged in.
- Topics: Active | Unanswered
#1 2018-11-14 17:16:45
- wondible
- Member
- Registered: 2018-04-19
- Posts: 855
Player experience and life length stats - Updated 2018-11-25
A while ago, Jason posed a question:
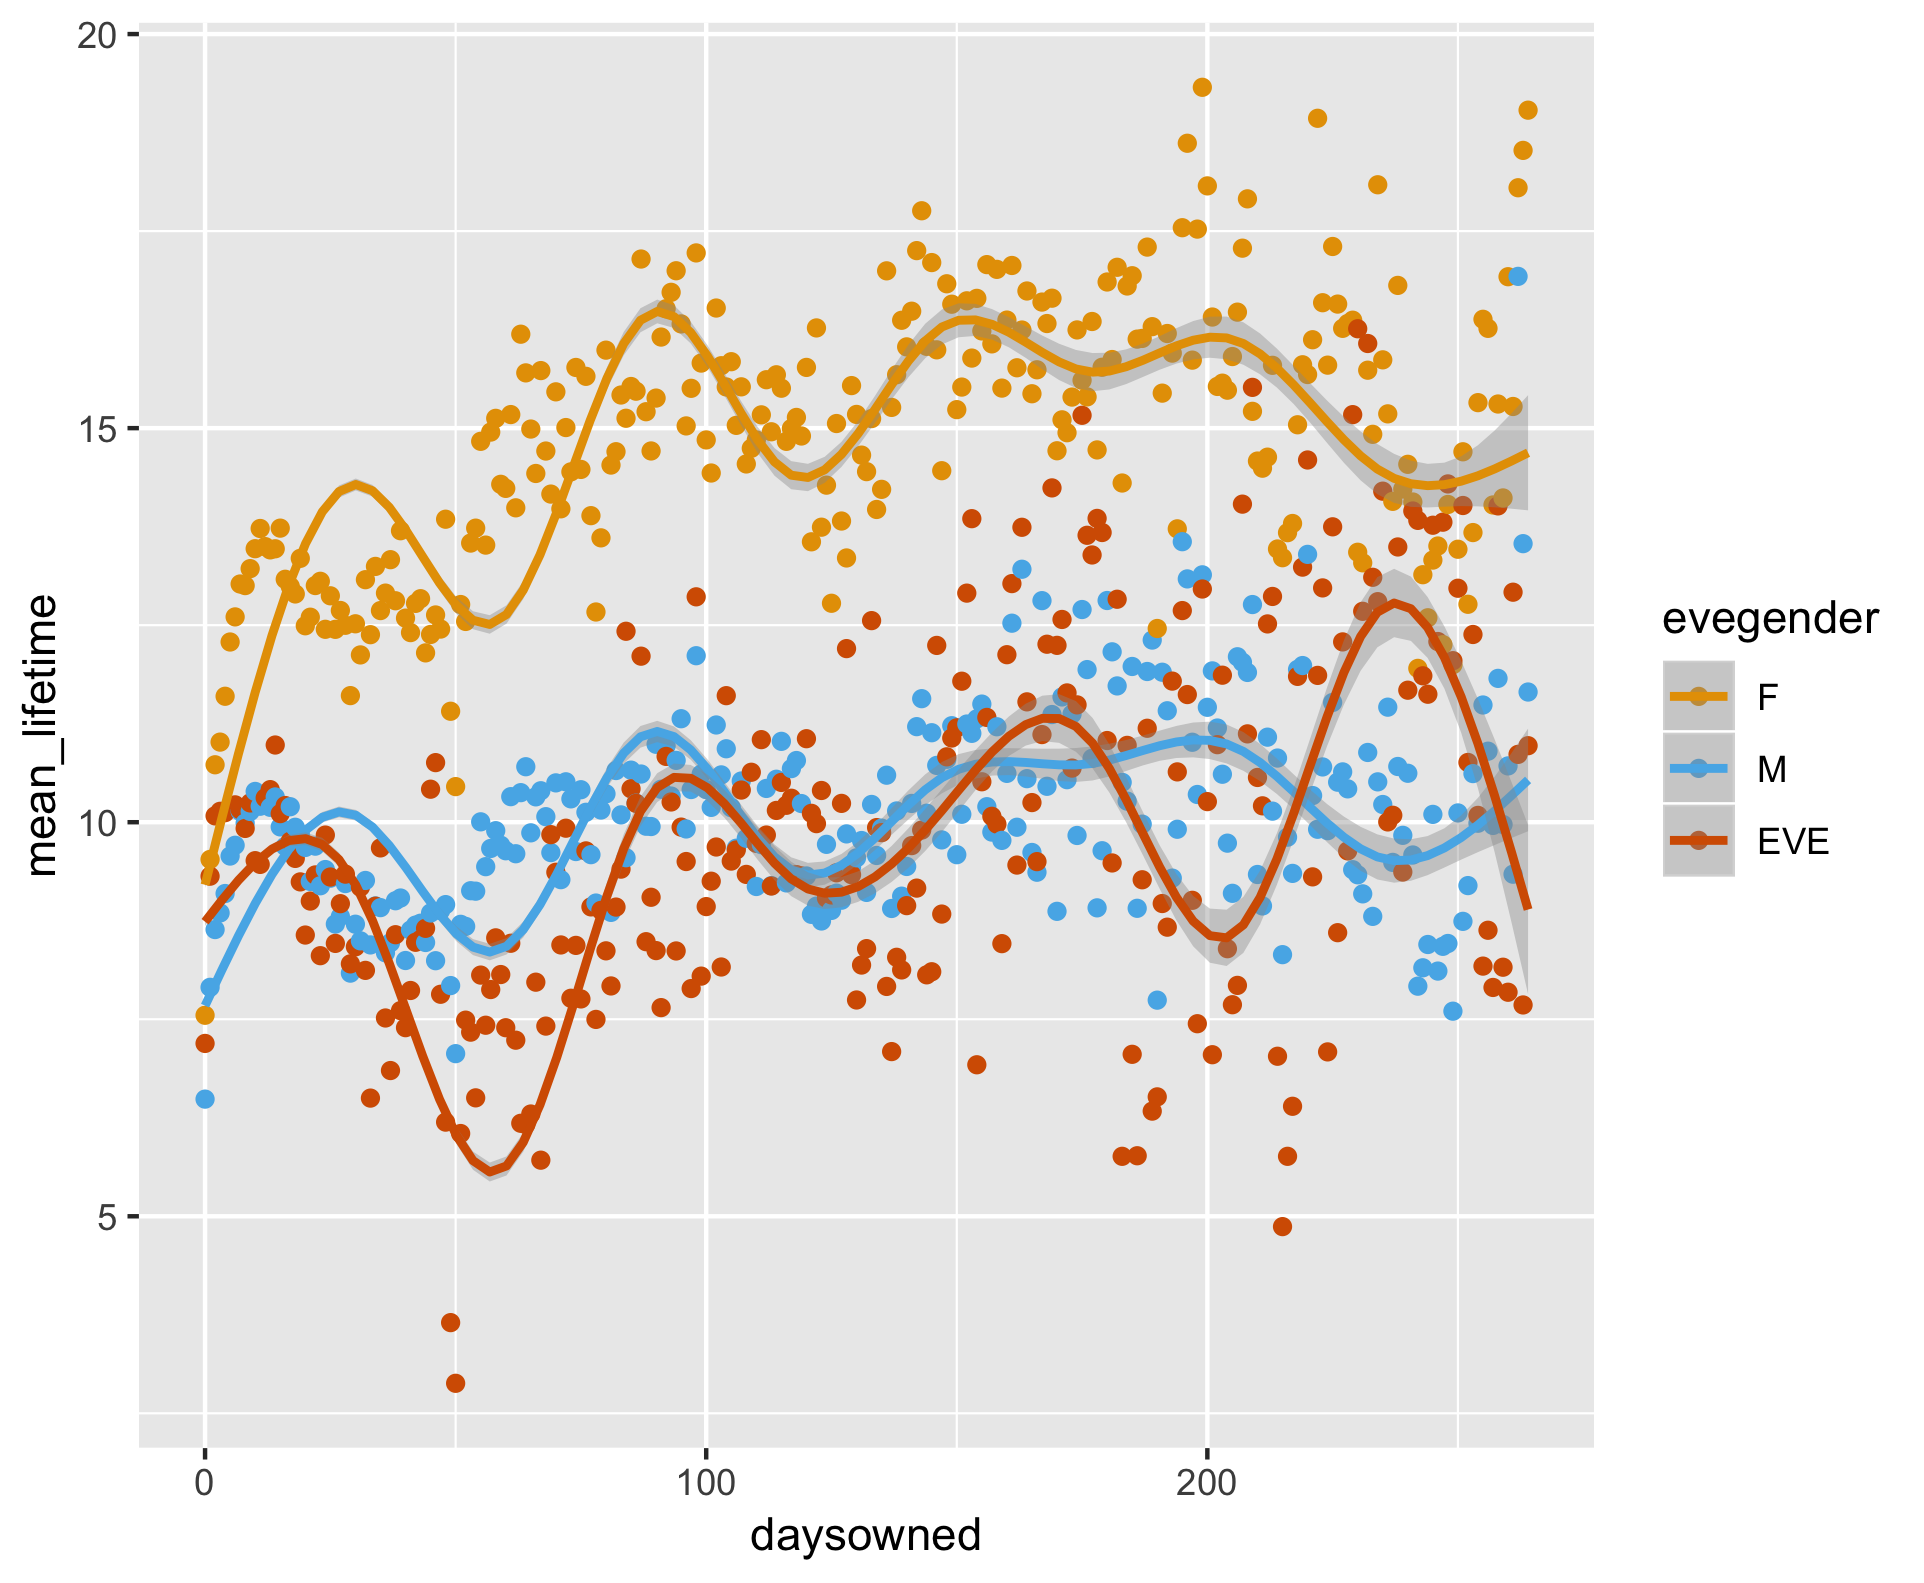
Player life expectancy (average life time per day) vs. number of days since game purchase.
I thought it would be a fun exercise to play with R. Several caveats:
I don't have a statistics background. No controls have been attempted, and I might be looking at the wrong things.
I think I've combined servers and such correctly, but maybe I didn't.
Data updated 2018-11-25.
To the initial question:
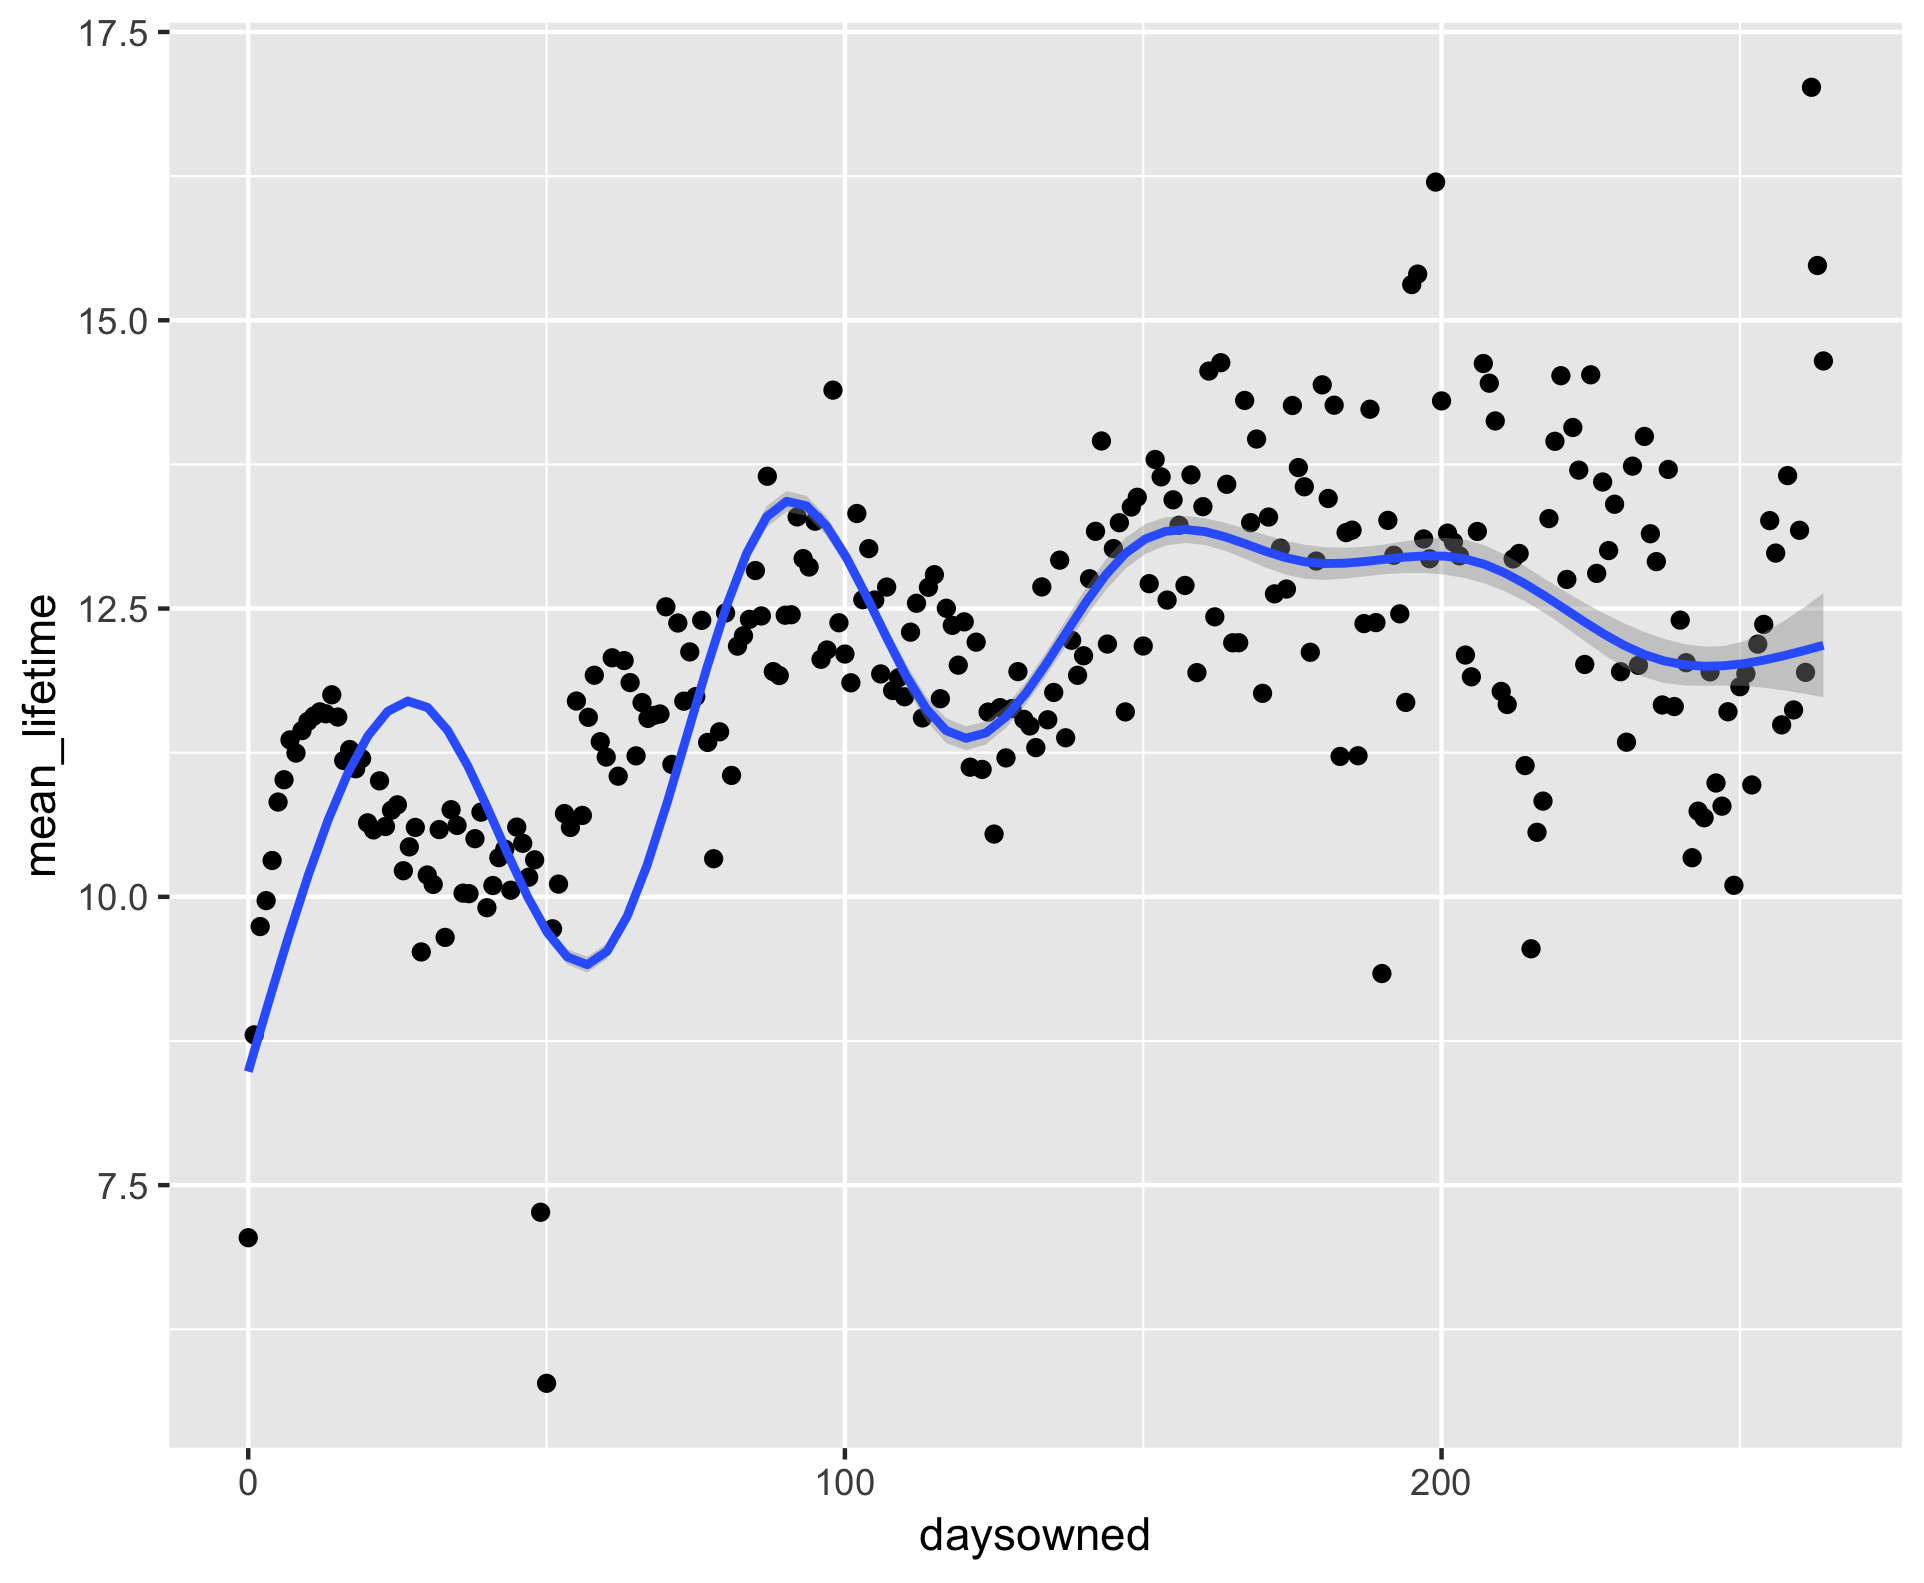
I suspect the scattering toward the high is due to fewer players in those groups, but don't know how to check that statistically.
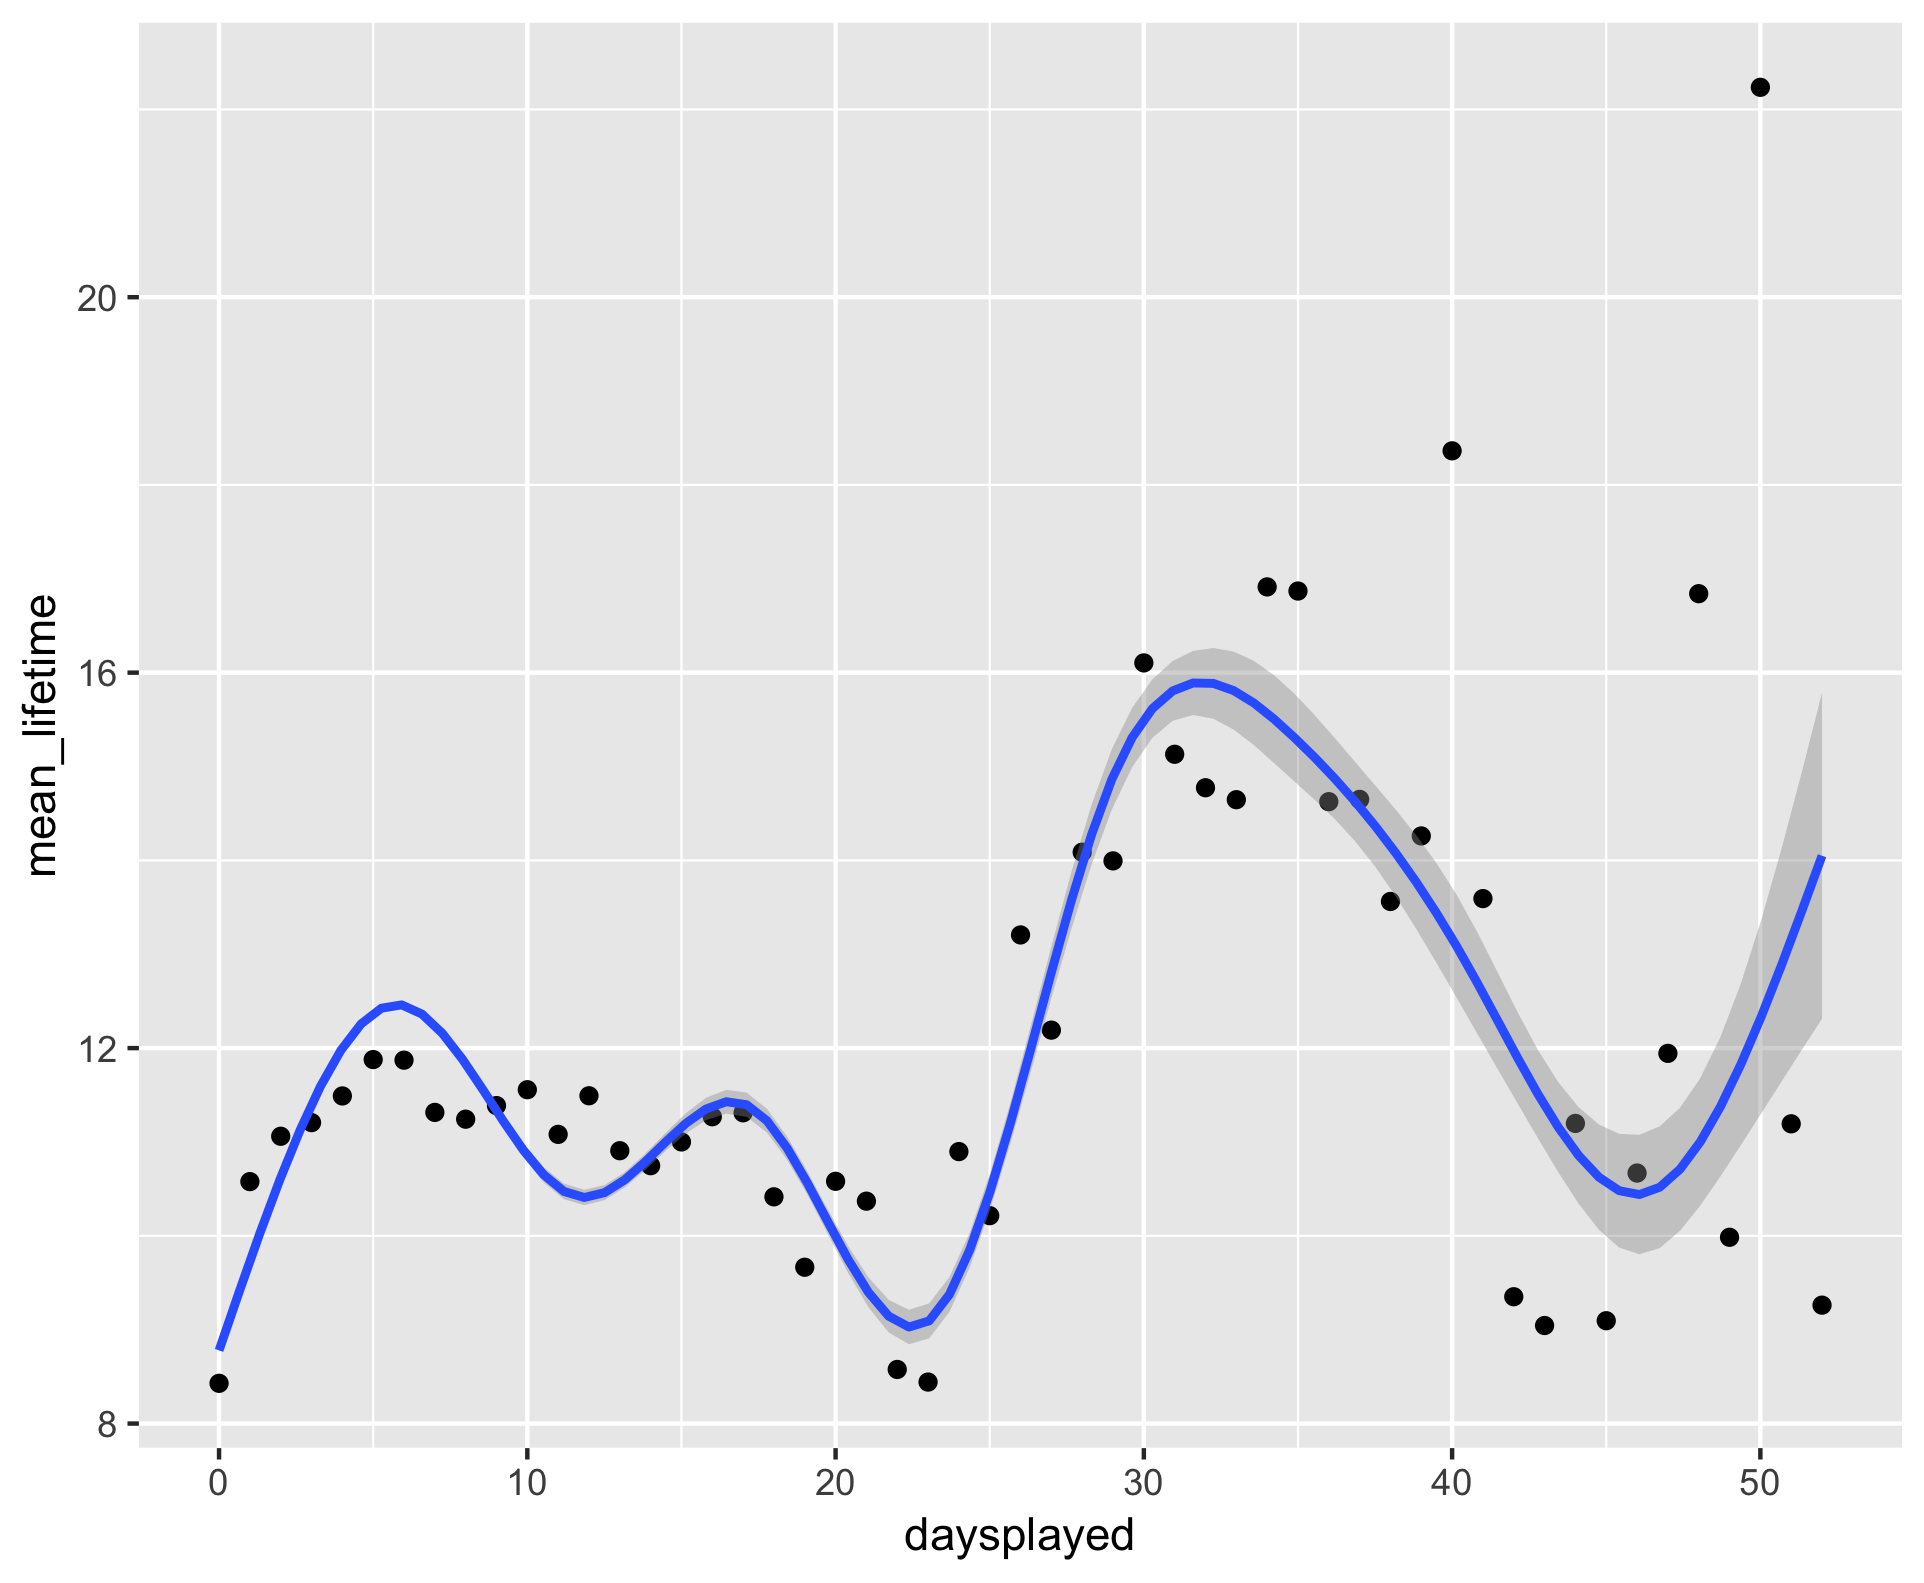
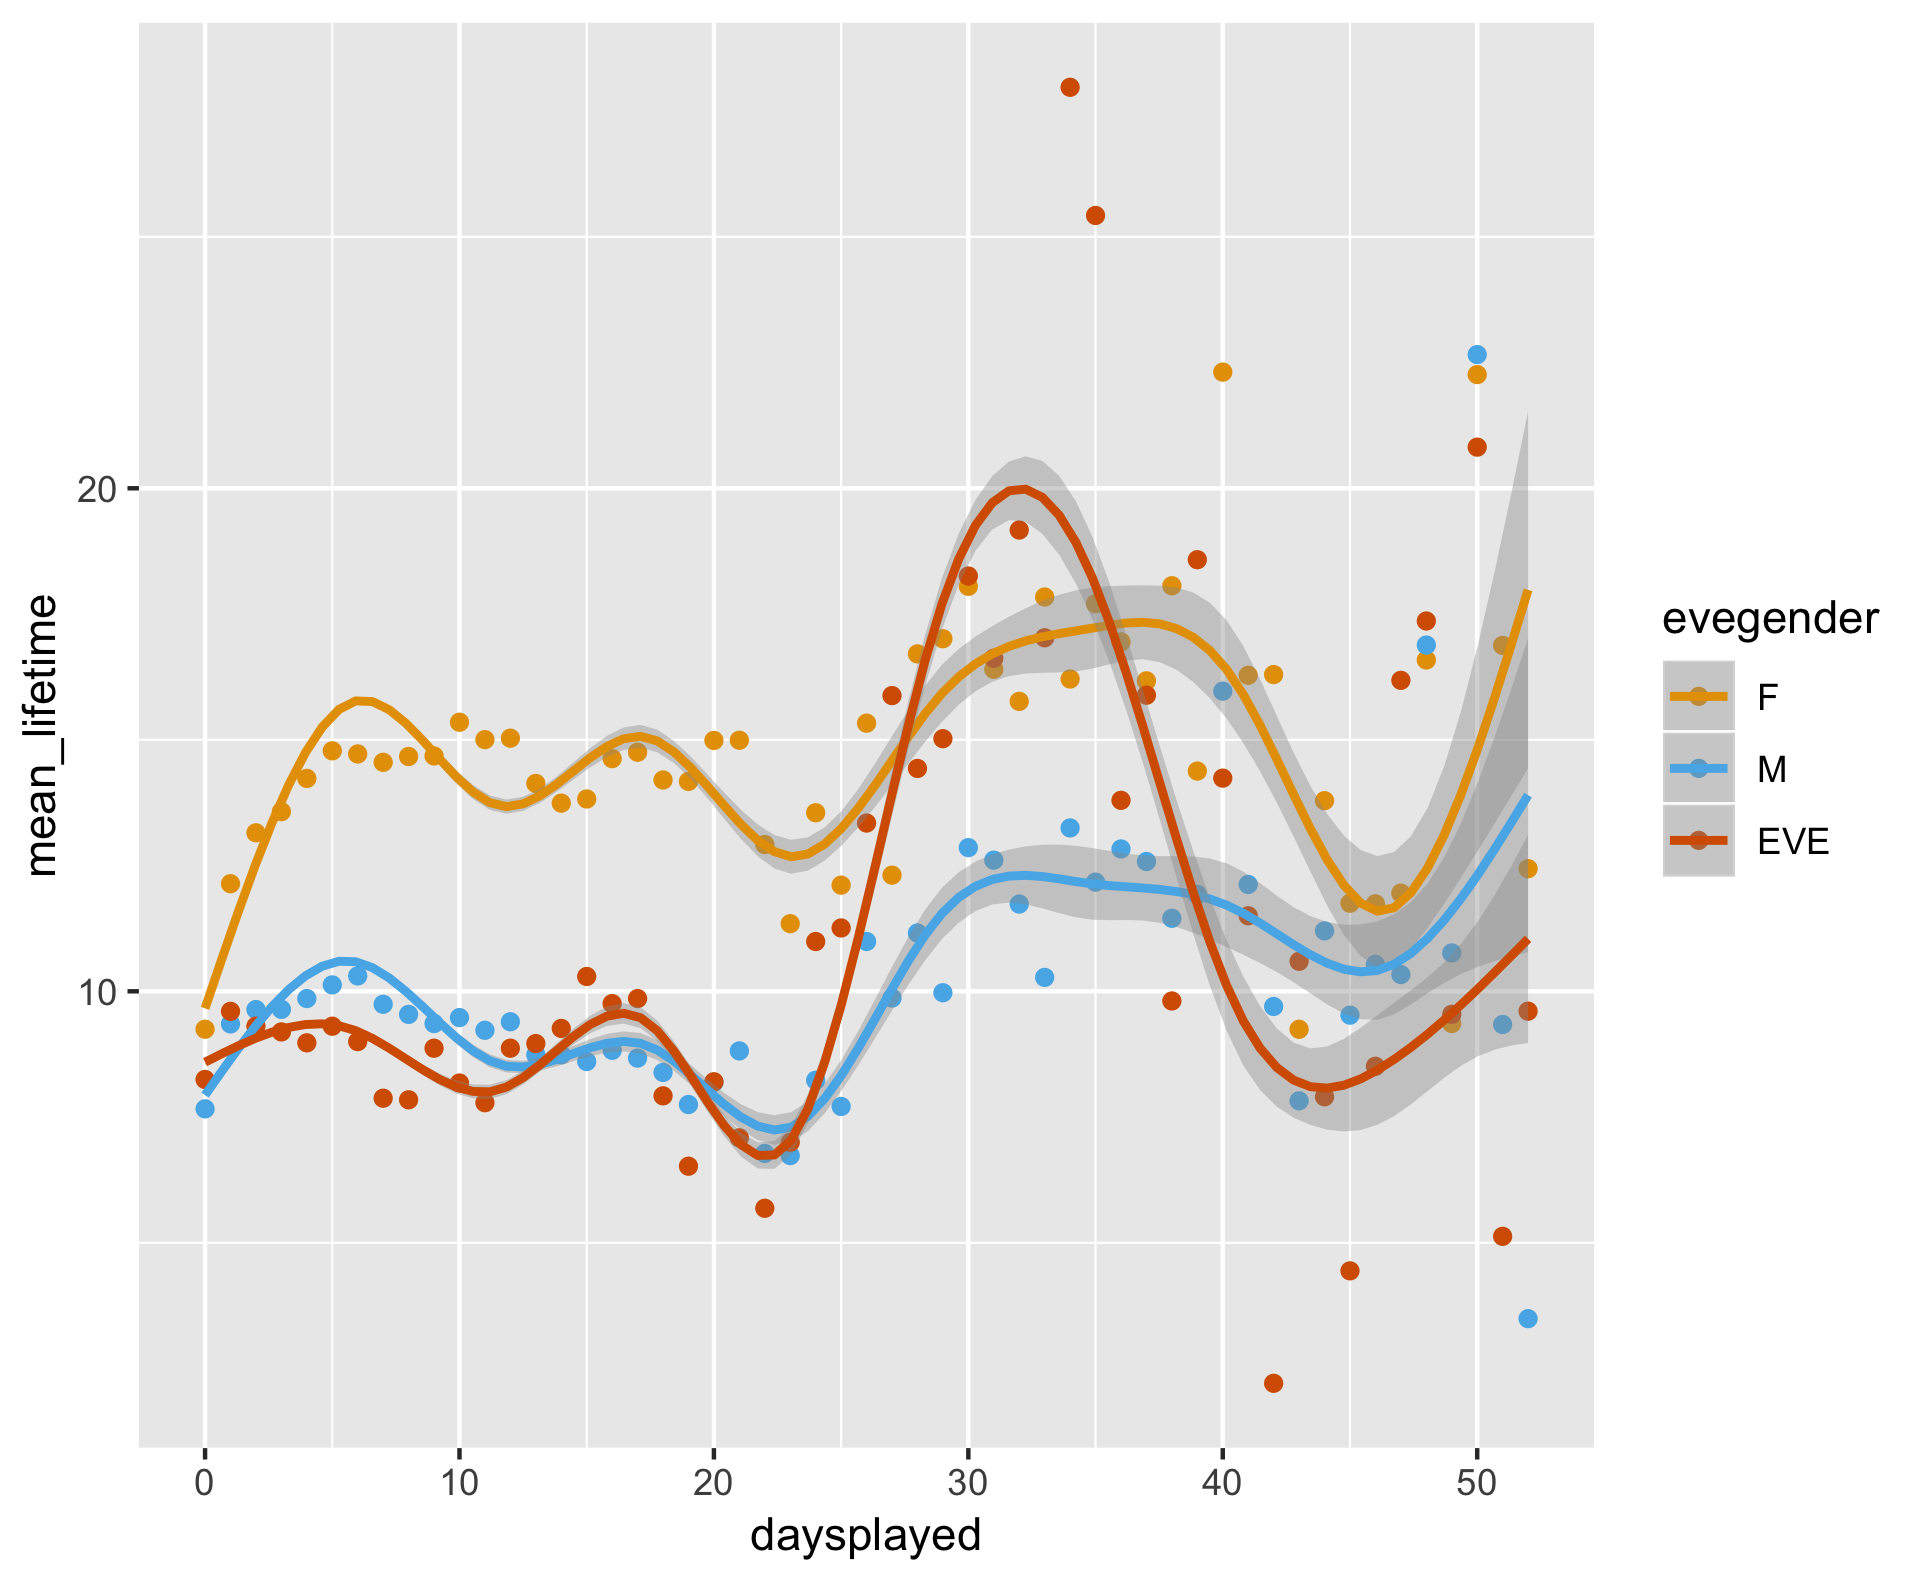
I was also curious about other related questions. For instance, days owned, which might have long gaps, vs. time played. I reduced it to days as well to get approximately similar units.
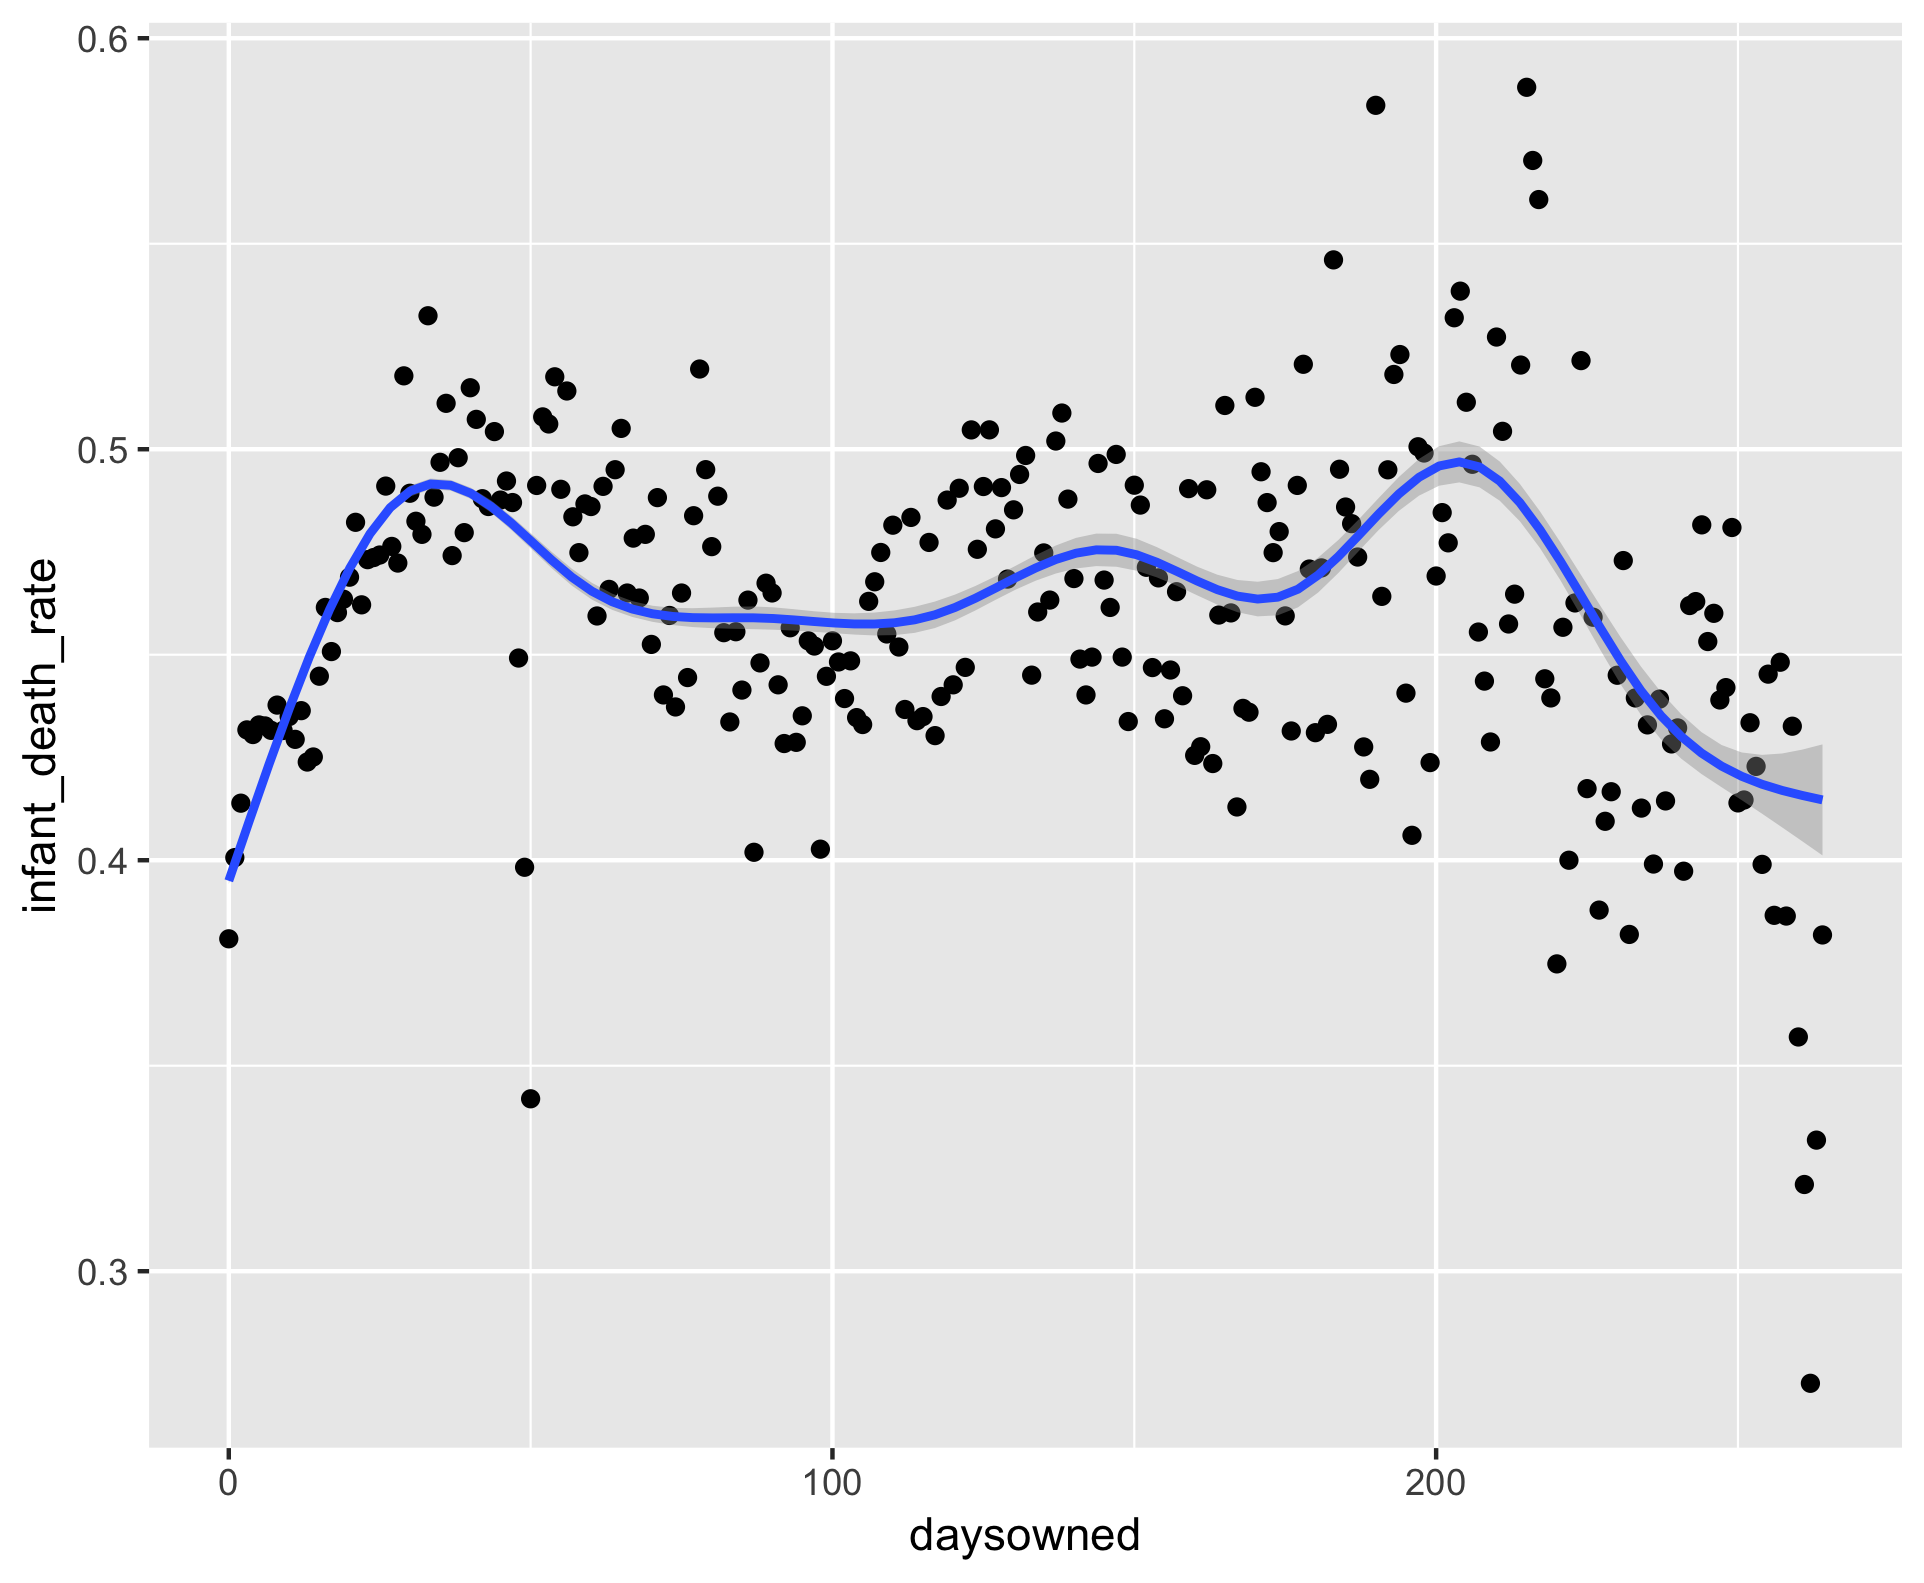
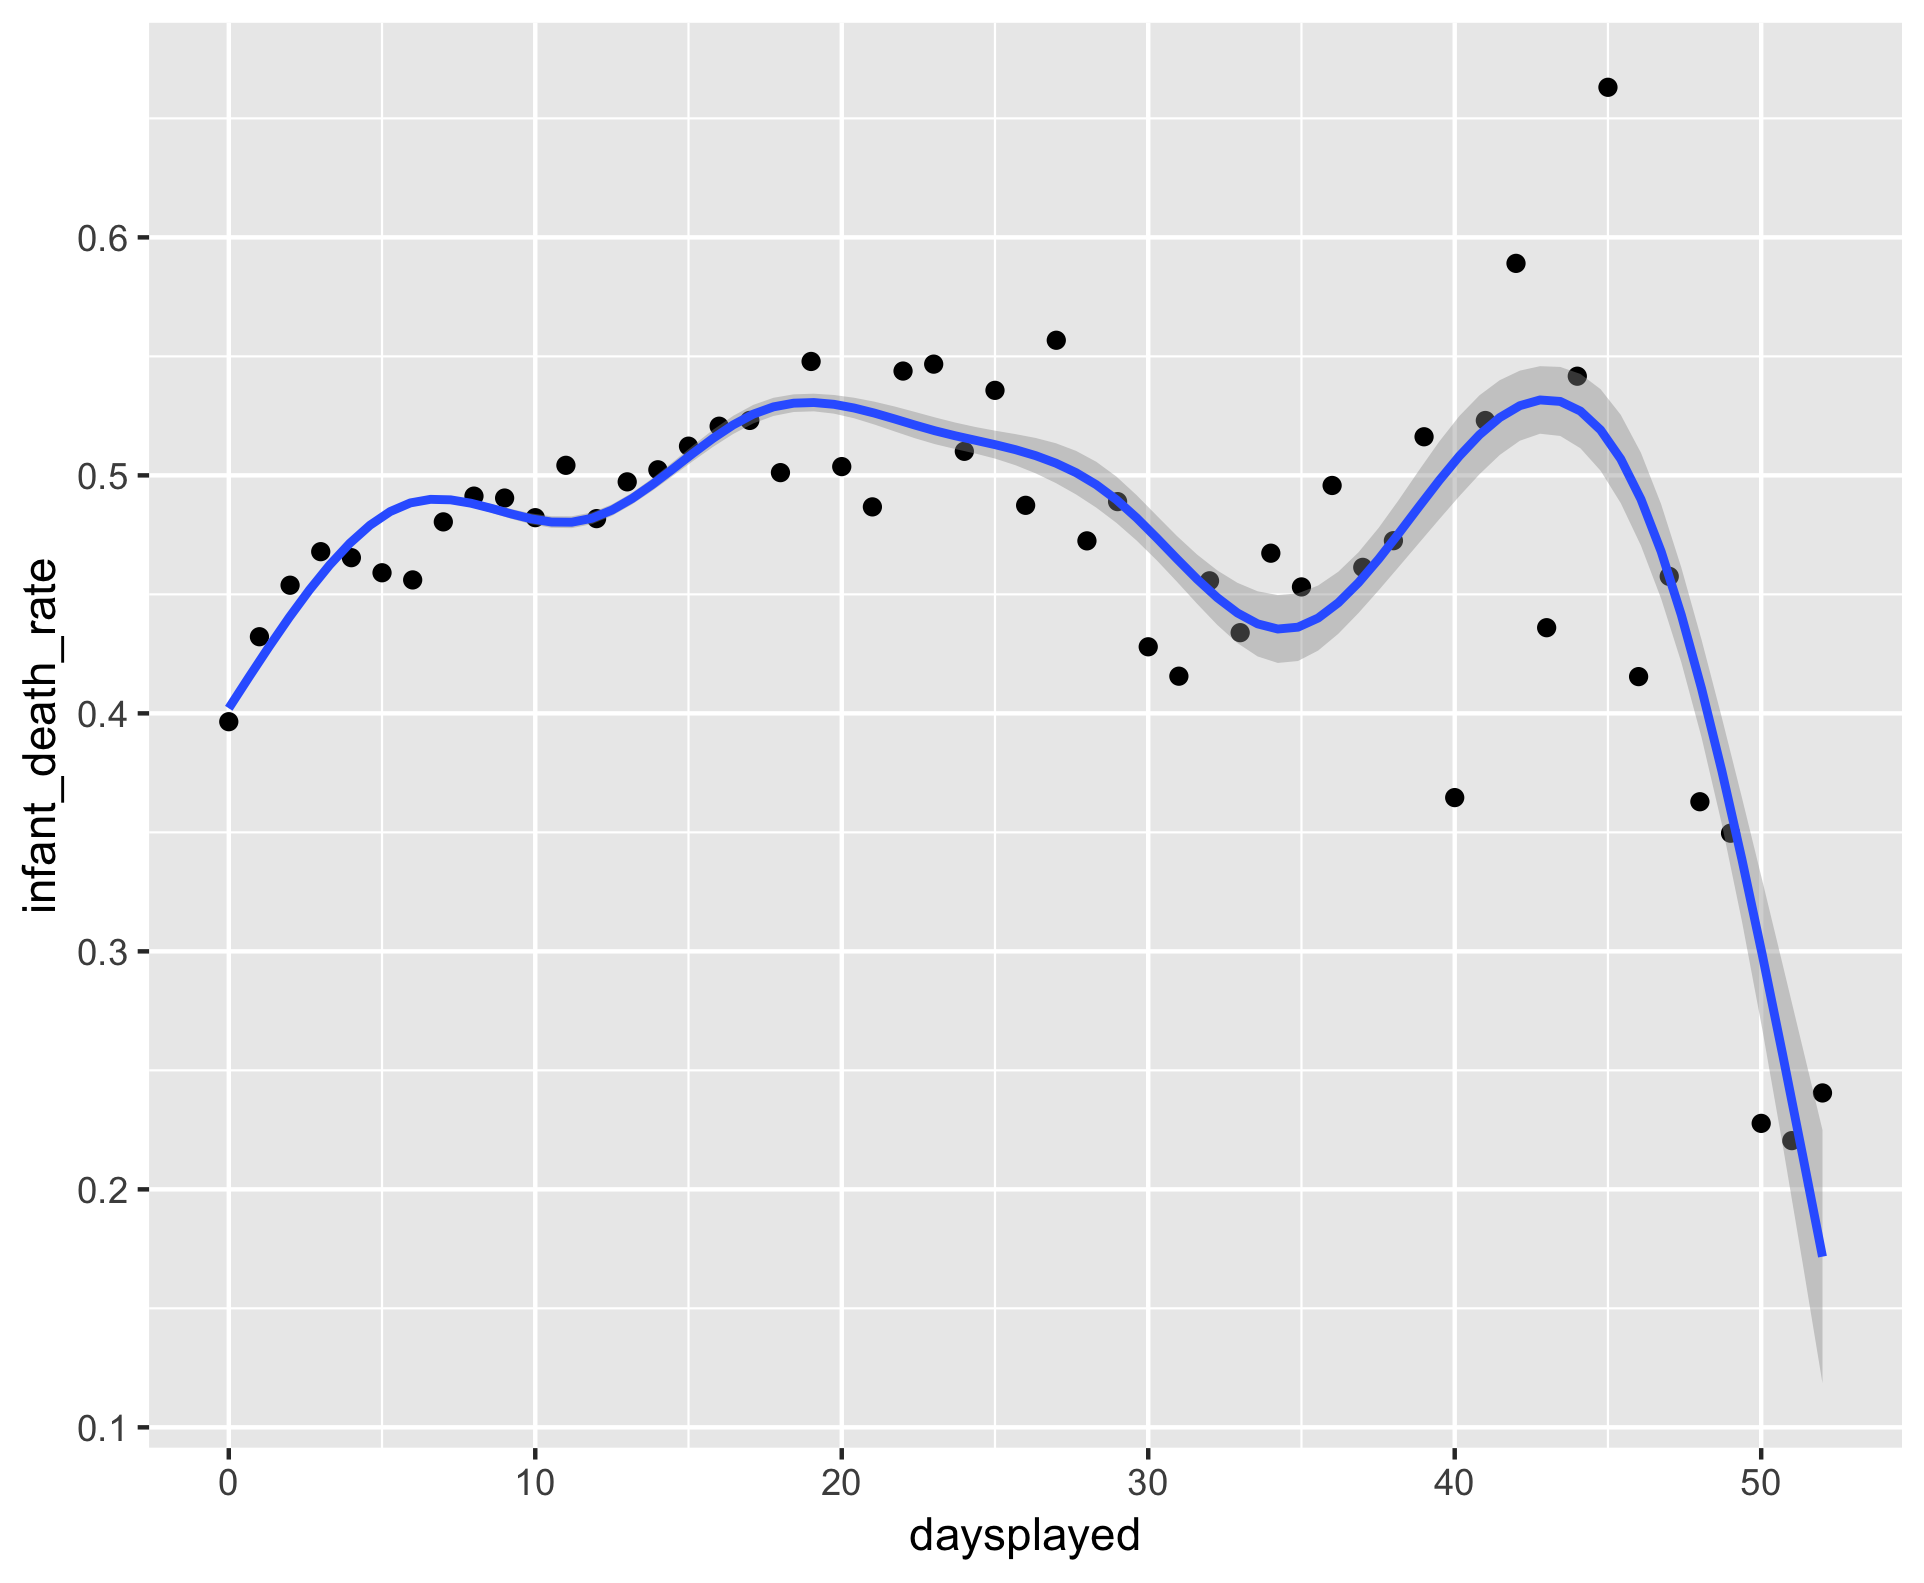
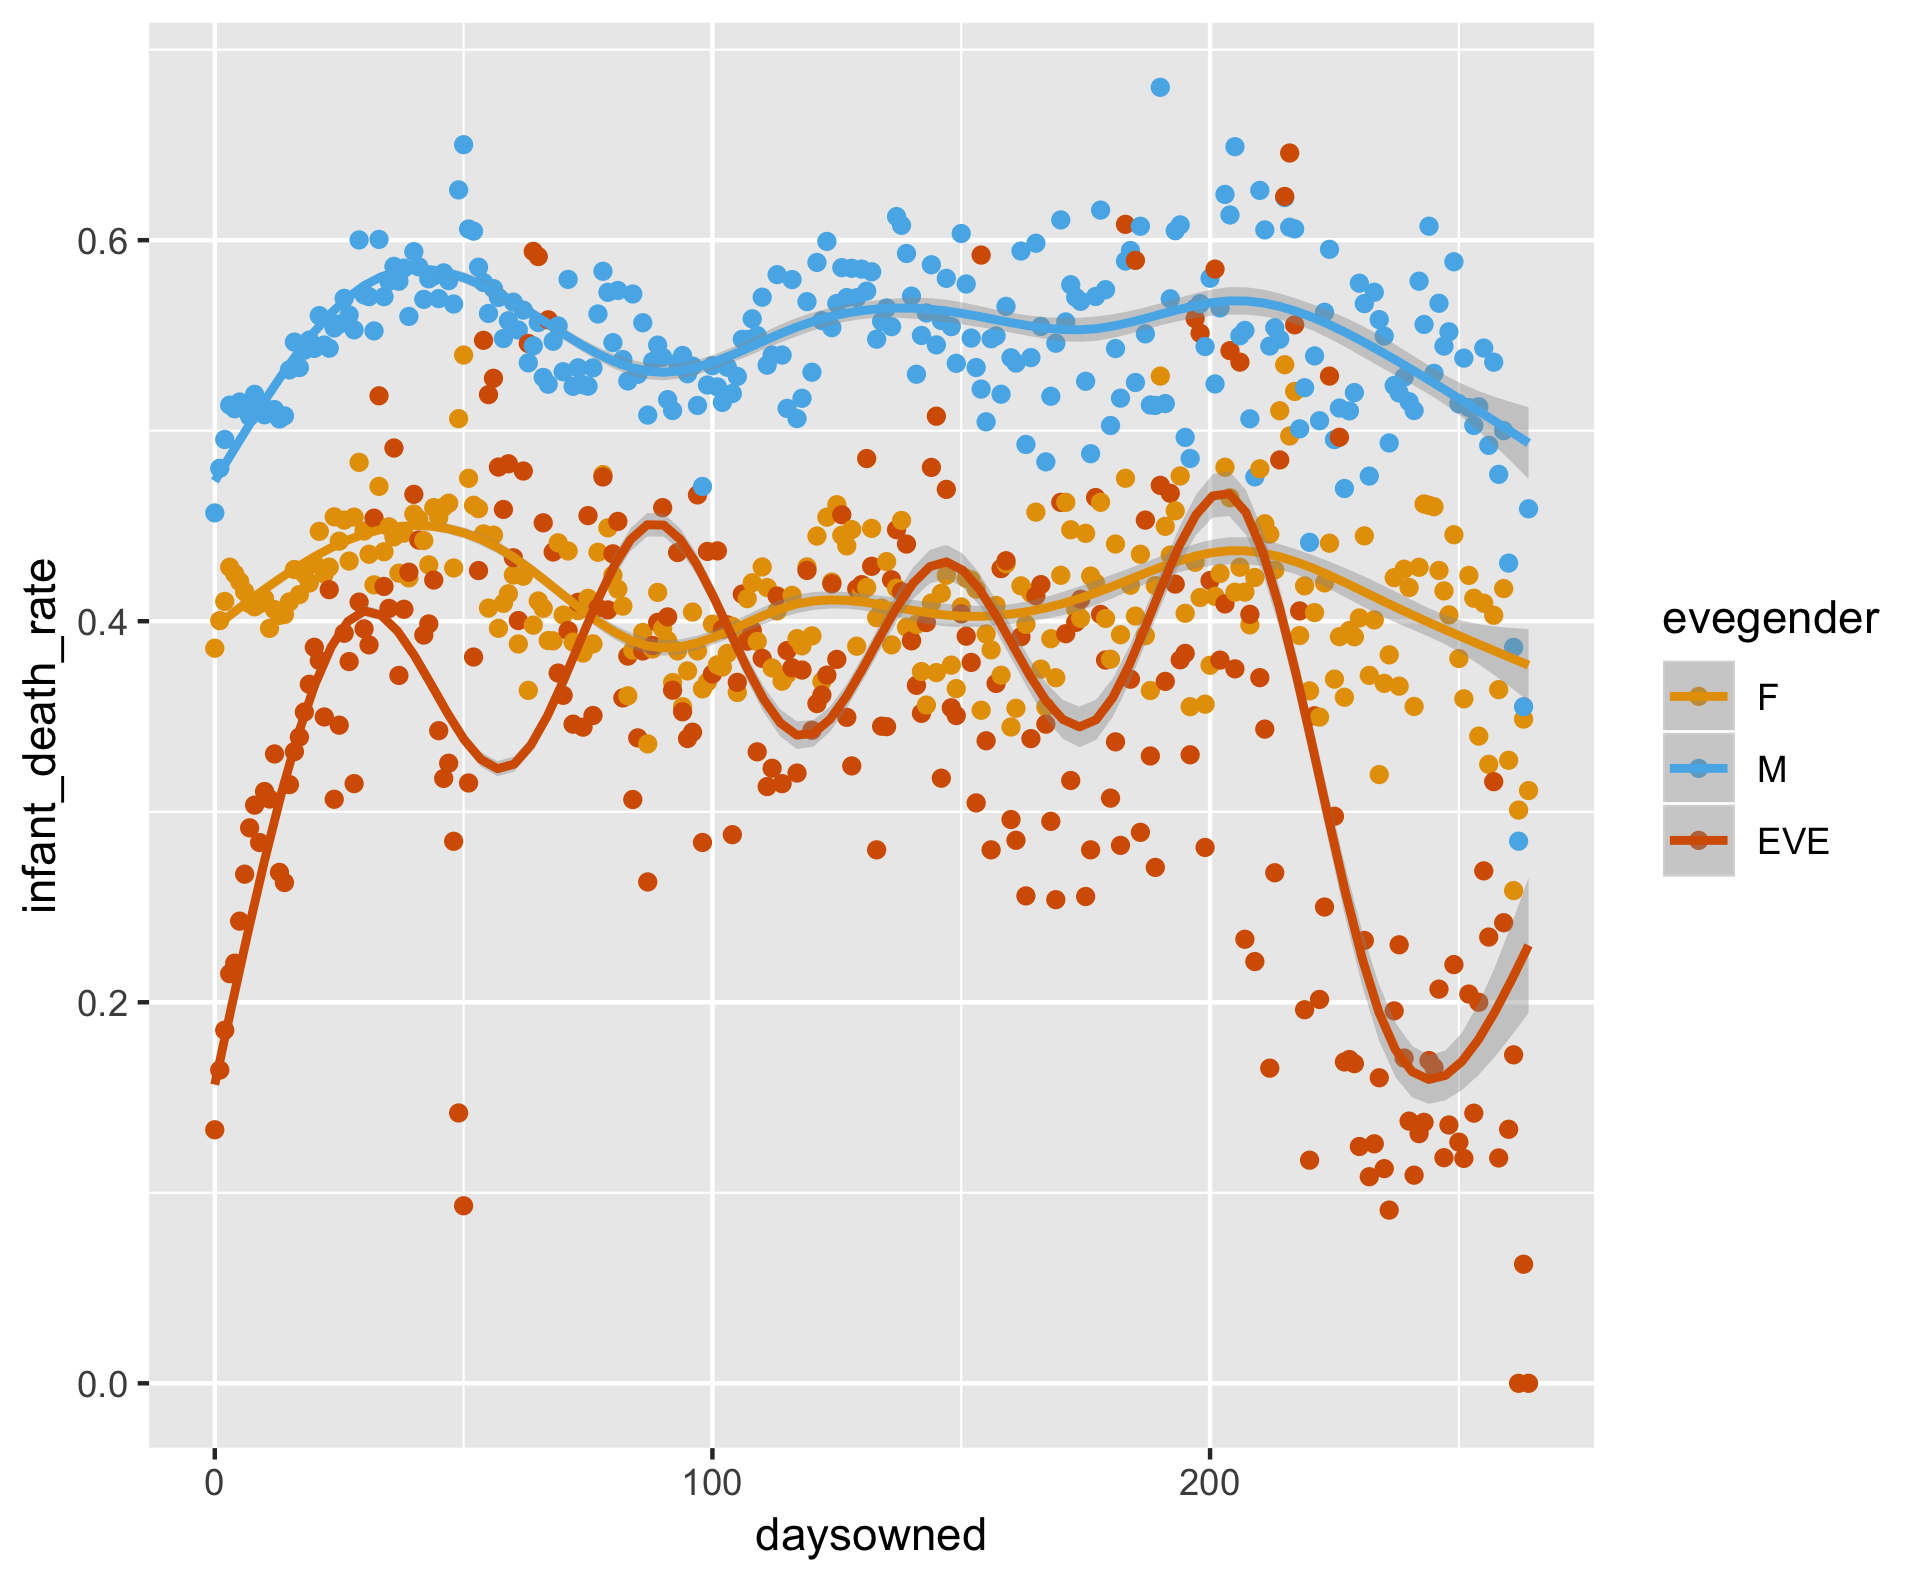
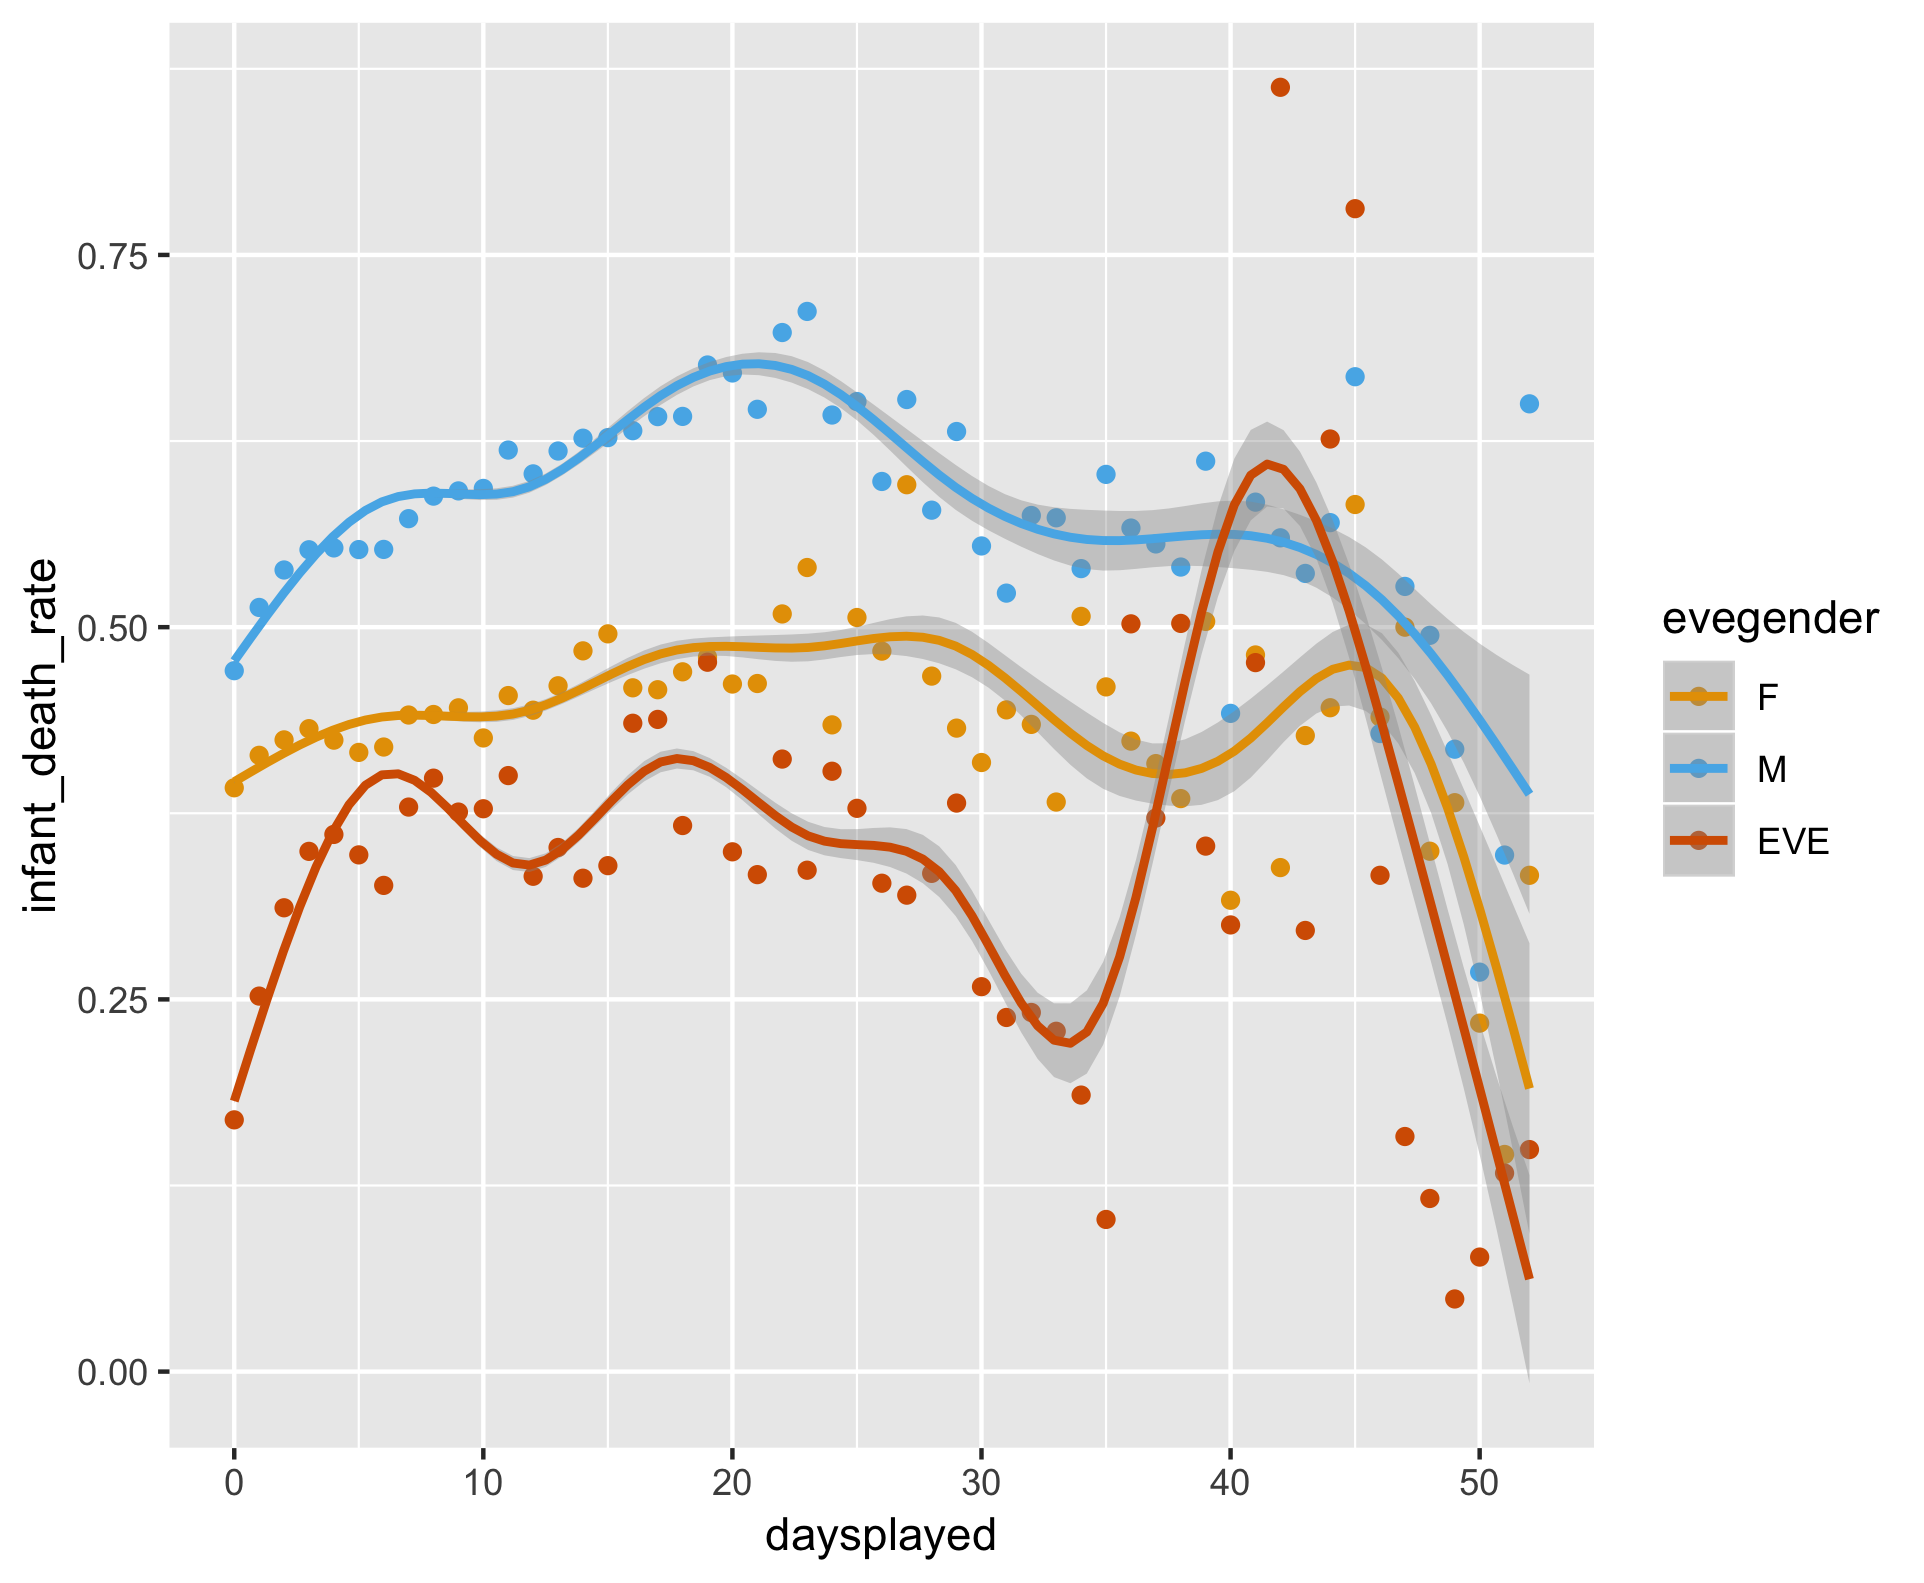
Since the original question was immediate suicide, I looked at rate of deaths at less than 1 year/minute of playtime.
Since people often treat boys differently, I broke this out by gender as well. I made eves separate because they have different potential life lengths and a different game situation in general.
First a little aside on the overall age distribution:
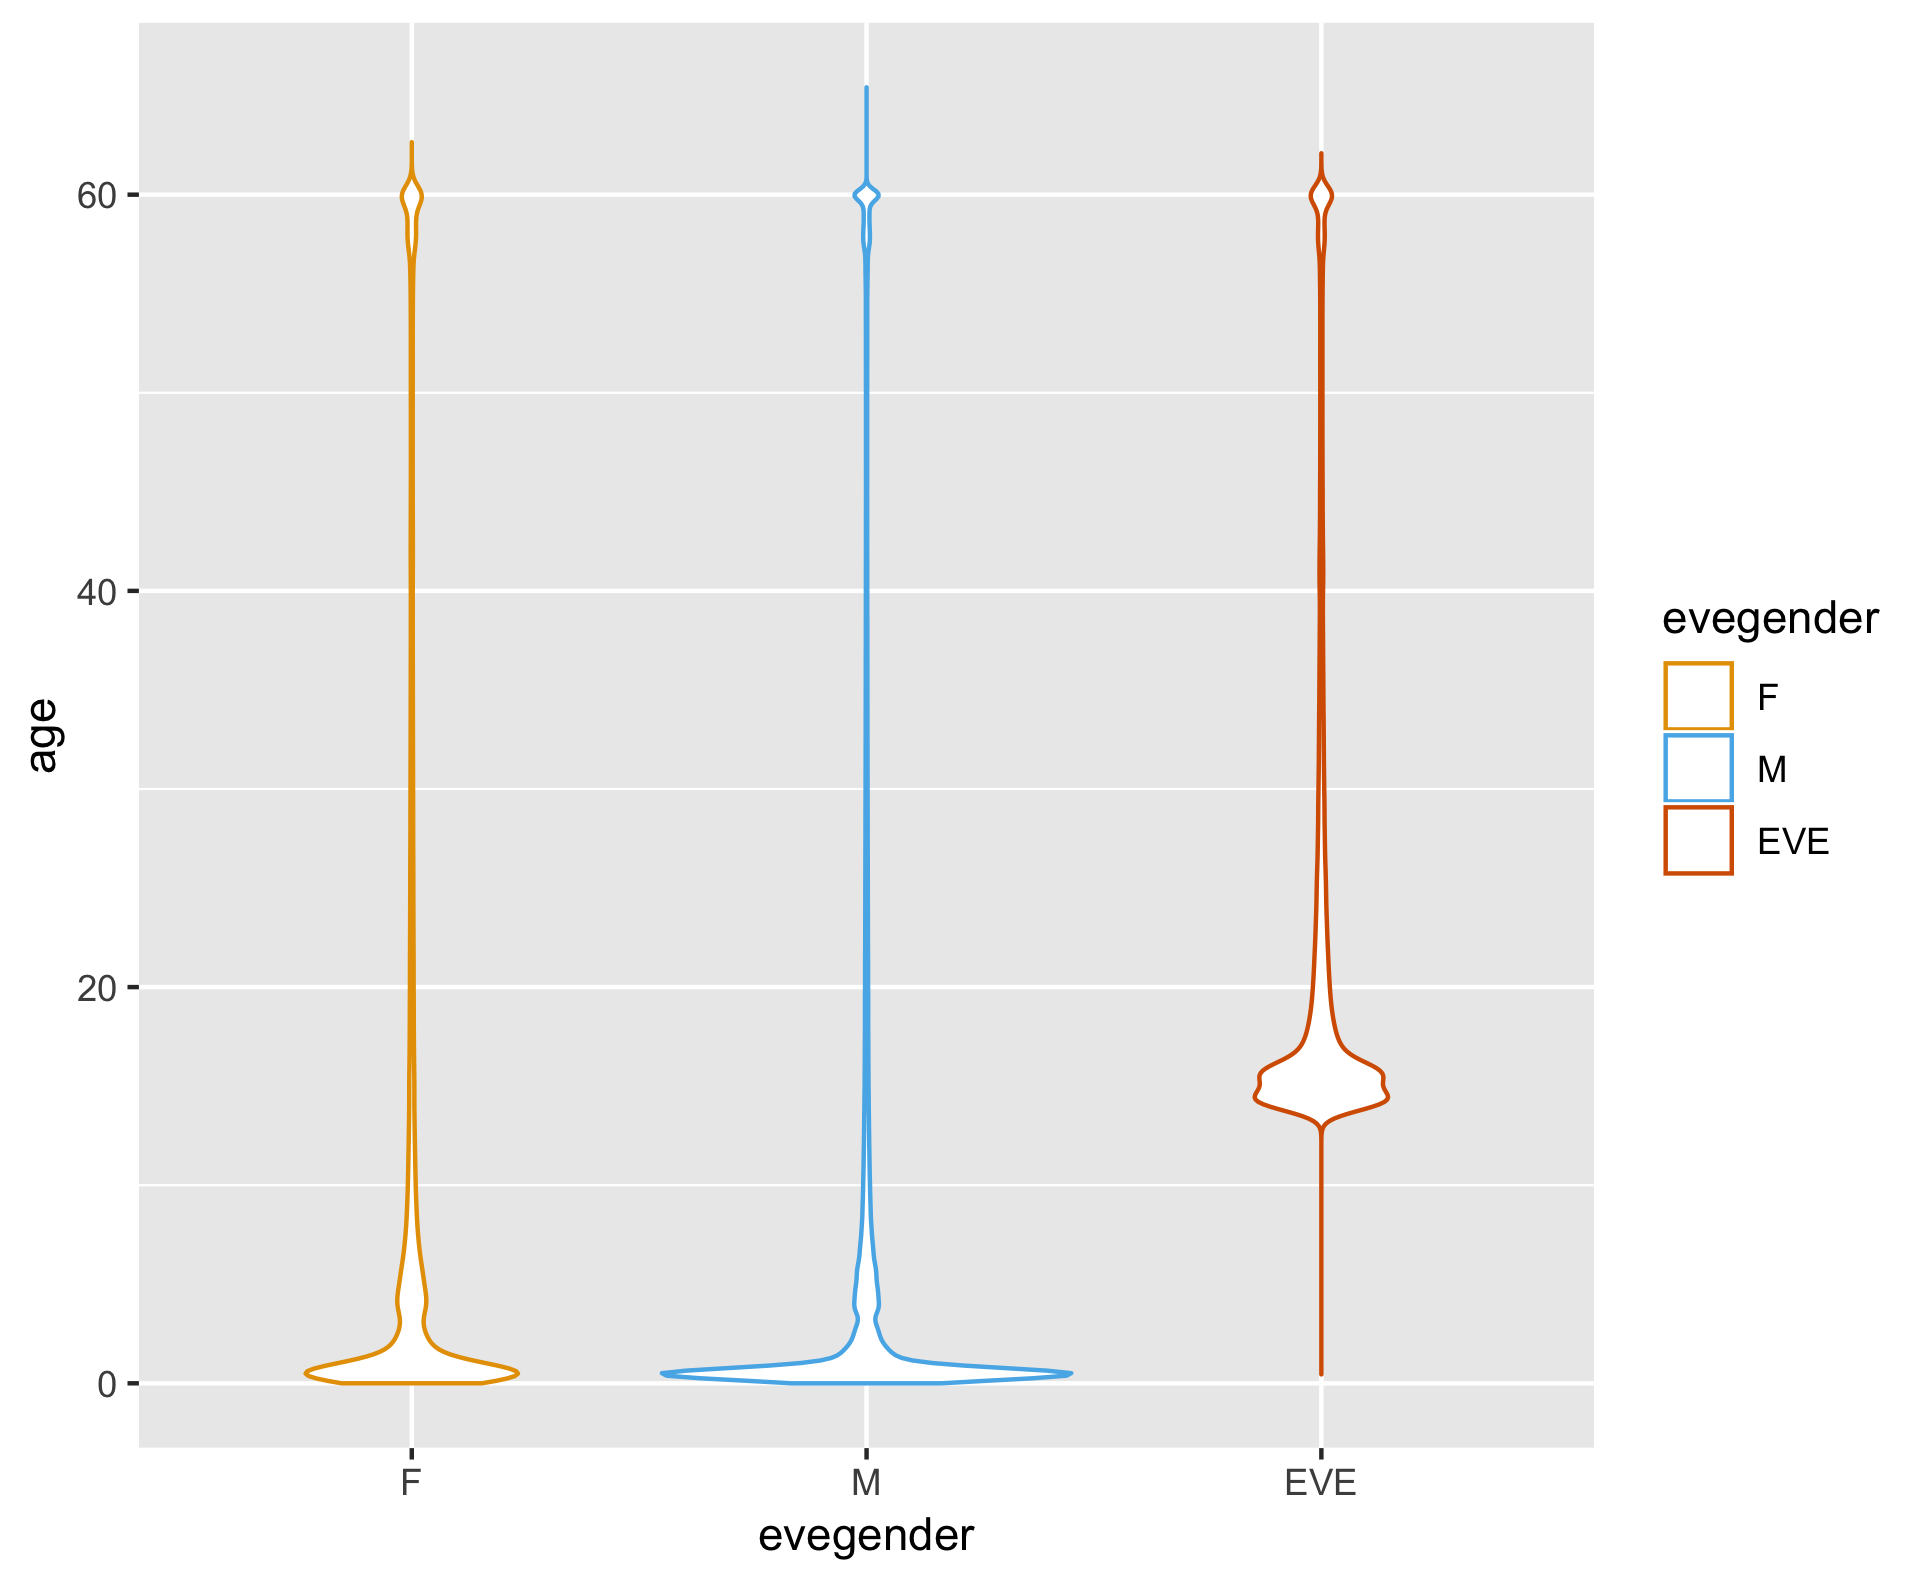
Less than a year is probably too little for eves who have larger food bar, if anything I wanted to keep them separate from the other stats.
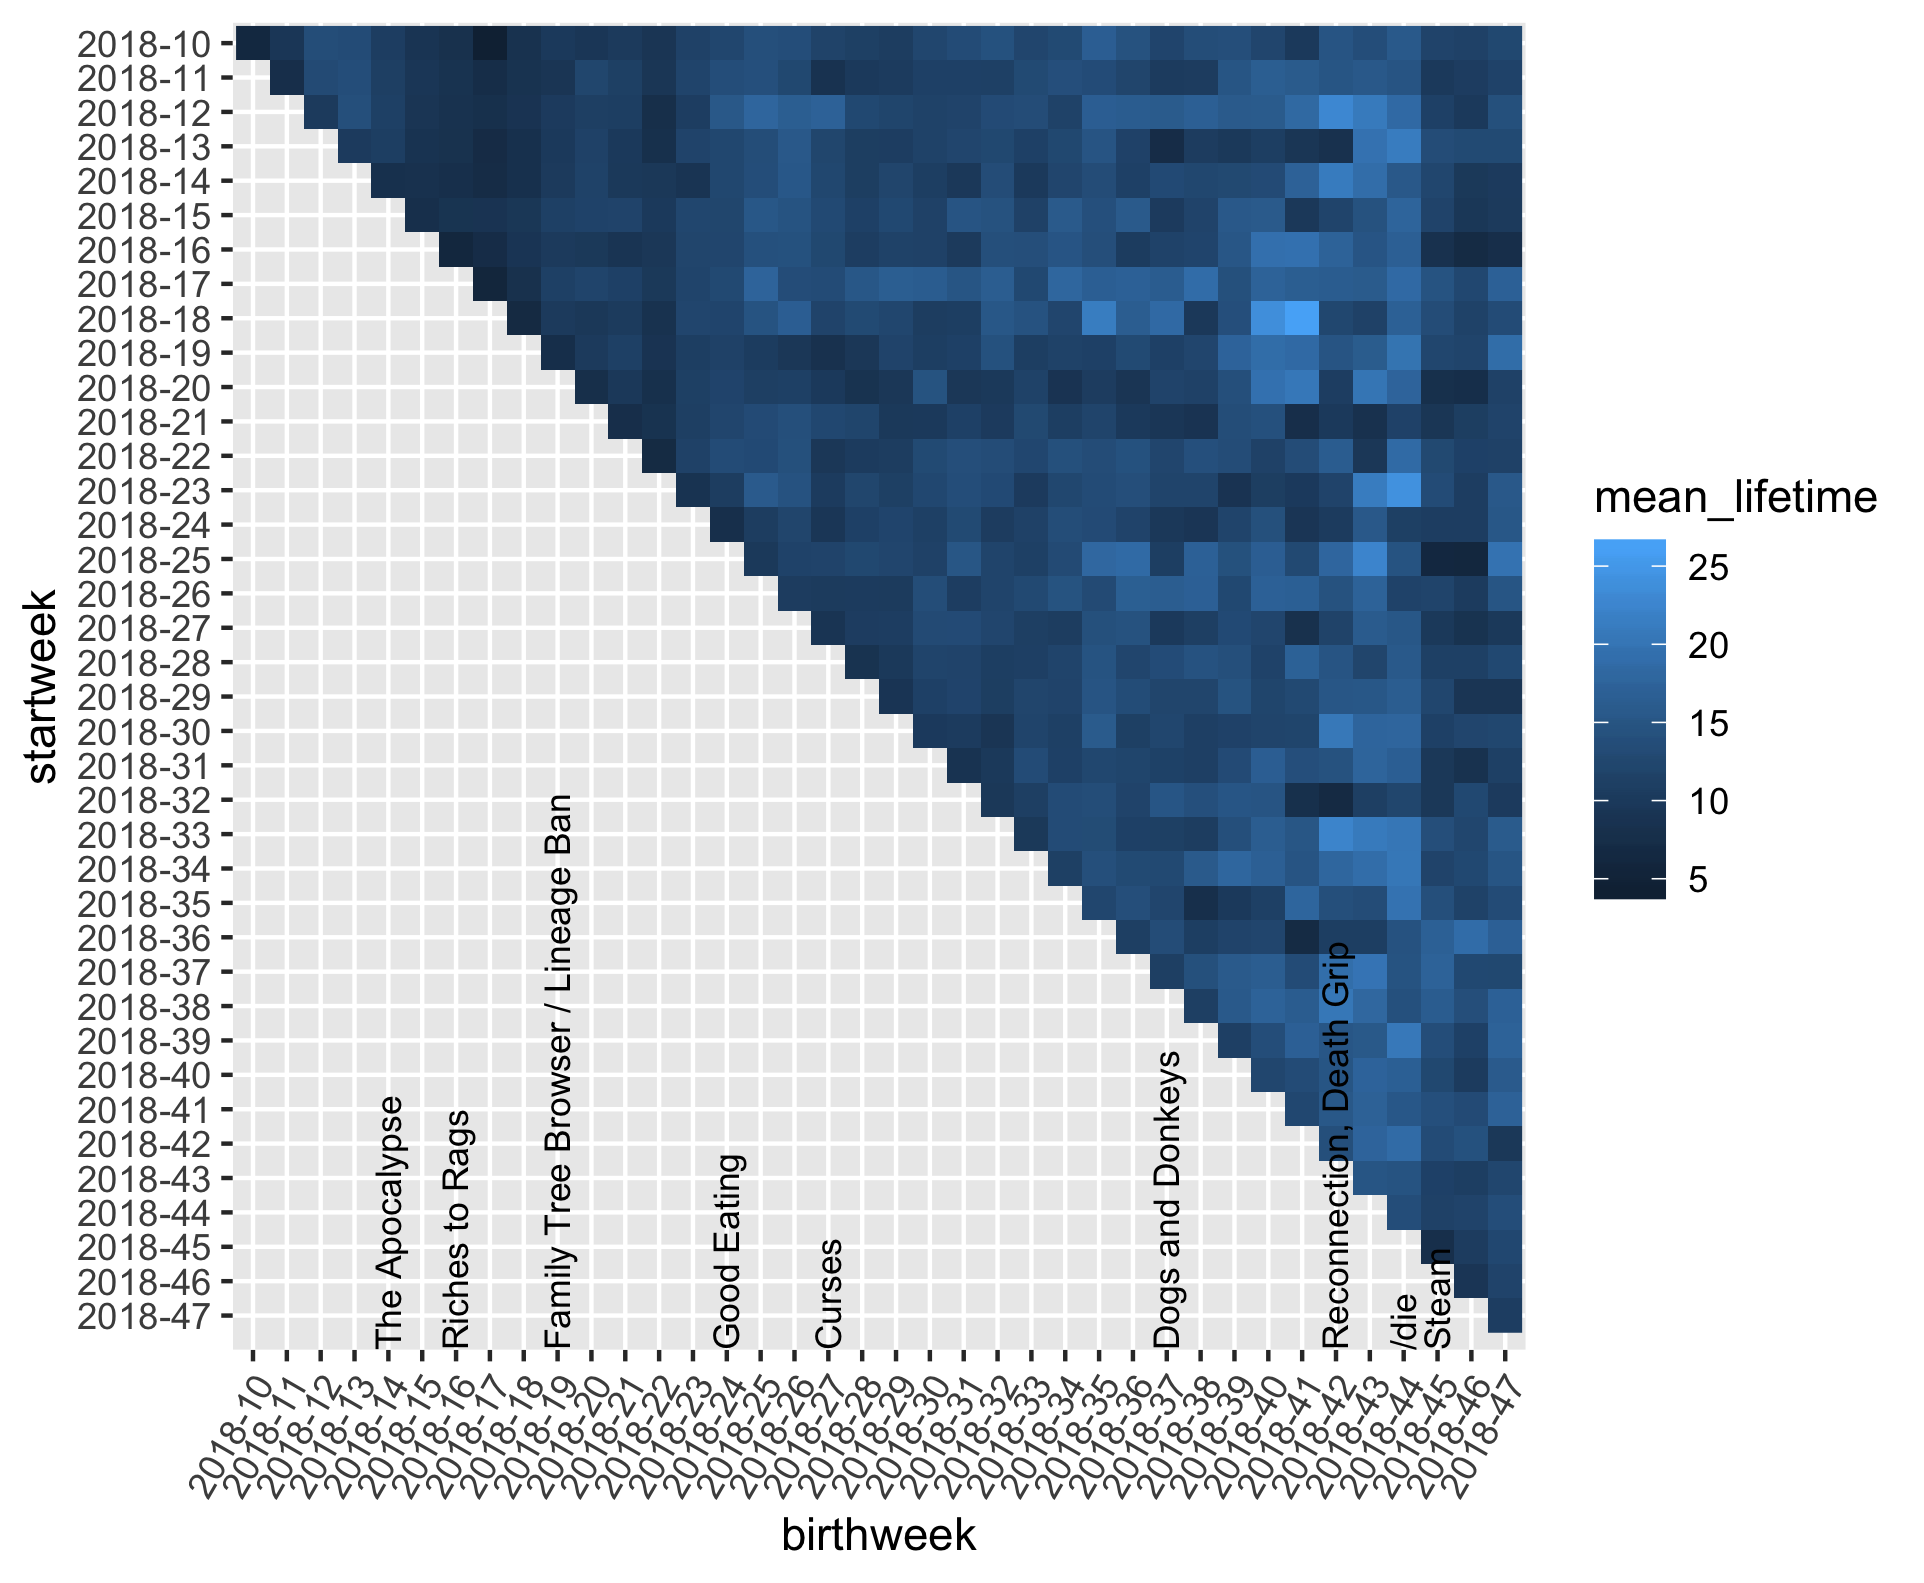
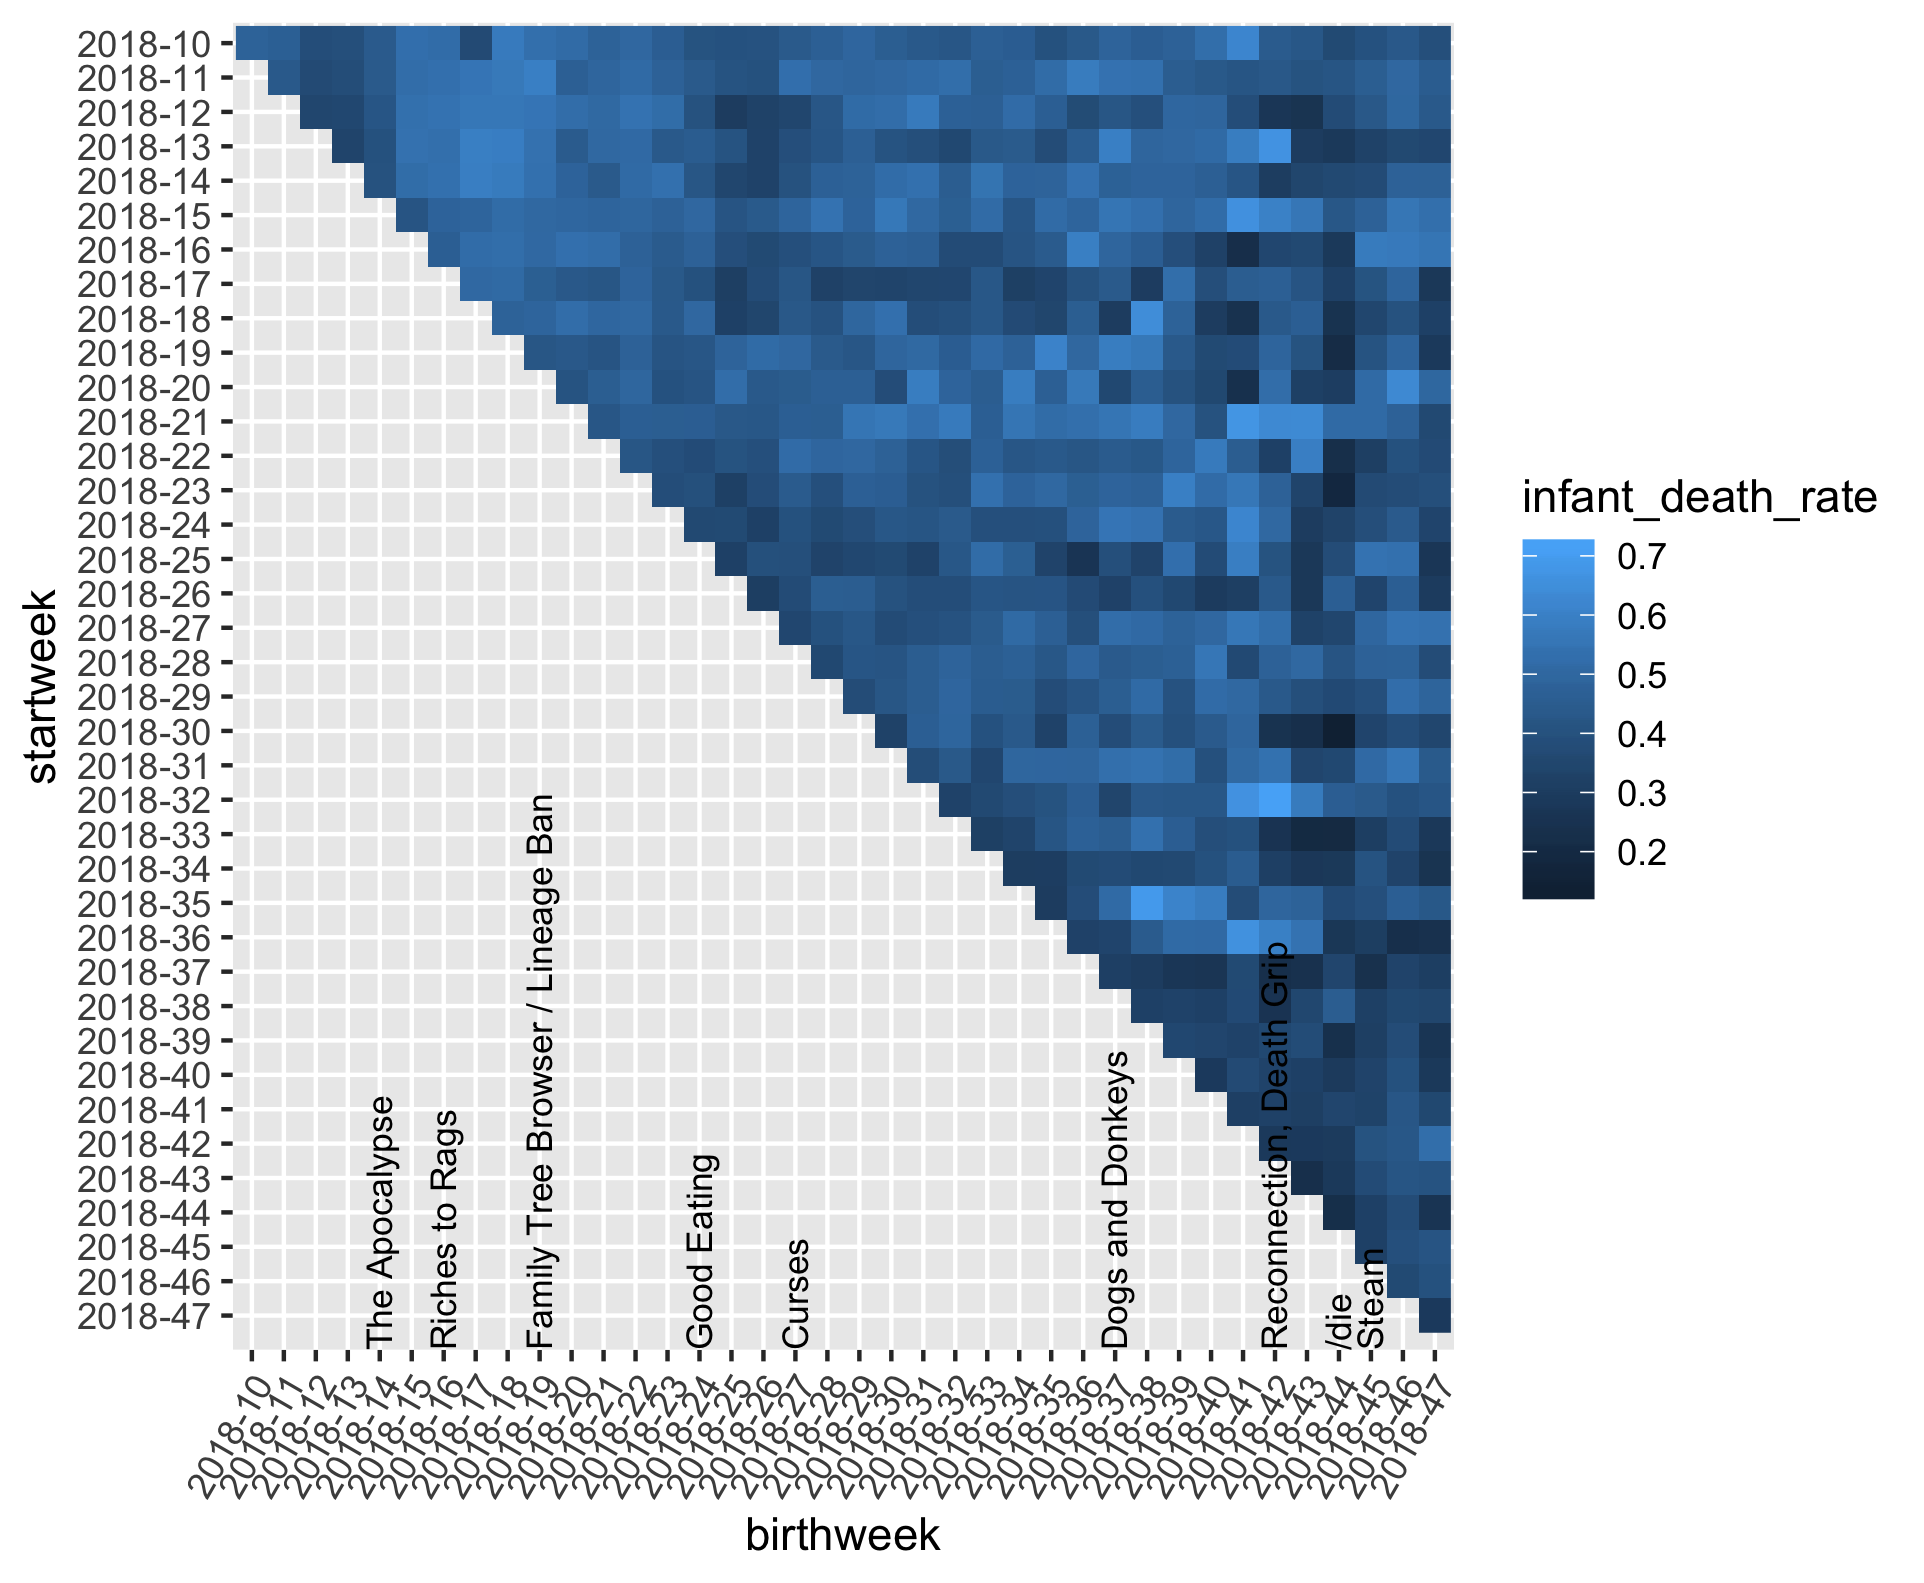
Finally, I thought it would be interesting to try a (totally unskilled) cohort analysis to see how different groups of players (week started with arbitrary week alignment) game updates interacted (Still haven't gotten a game update overlay).
Note that I have not attempted to deal with first and last partial weeks, but these are not sums so should still be relatively valid.
Last edited by wondible (2018-11-25 16:08:46)
https://onemap.wondible.com/ -- https://wondible.com/ohol-family-trees/ -- https://wondible.com/ohol-name-picker/
Custom client with autorun, name completion, emotion keys, interaction keys, location slips, object search, camera pan, and more
Offline
#2 2018-11-14 17:39:16
- GnarSlabdash
- Member
- Registered: 2018-10-29
- Posts: 5
Re: Player experience and life length stats - Updated 2018-11-25
It looks like you have one point per unit of the x axis, instead of individual level data. How did you take the many individuals who fall into each bin and compress that into a single point?
Also since the compression of information occurs, it might be interesting to see the density plot of the days owned and of days played.
It also would be neat to see the curve of best fit on the 1st and 3rd graphs, along with the confidence interval, using geom_smooth().
Offline
#3 2018-11-15 08:32:00
- pein
- Member

- Registered: 2018-03-31
- Posts: 4,337
Re: Player experience and life length stats - Updated 2018-11-25
i might be an odd egg
i dont like to be female and sometimes opt against it
and i dont like too many females on camp
i dont really starve on accident, i might have very high before 3 year old deaths but also mostly 60 min deaths
ofc it plays a purpose, some people want action, many people around
when i was making my outpost near bonsai garden eventually everyone came up there cause we were doing well and they were bored alone
so death before age 60 might be cause no one is around
https://onehouronelife.com/forums/viewtopic.php?id=7986 livestock pens 4.0
https://onehouronelife.com/forums/viewtopic.php?id=4411 maxi guide
Playing OHOL optimally is like cosplaying a cactus: stand still and don't waste the water.
Offline
#4 2018-11-15 23:51:58
- Izzytok
- Member
- Registered: 2018-05-07
- Posts: 66
Re: Player experience and life length stats - Updated 2018-11-25
Nice analysis. I think the amount played is more important than time owned. You can still be a newb, even if you bought the game on release ![]() . The mean lifetime vs. days played graph seems pretty odd to me. Like, the discontinuity at ~25 years seems very uncharacteristic after such a smooth run...
. The mean lifetime vs. days played graph seems pretty odd to me. Like, the discontinuity at ~25 years seems very uncharacteristic after such a smooth run...
Offline
#5 2018-11-25 16:20:30
- wondible
- Member
- Registered: 2018-04-19
- Posts: 855
Re: Player experience and life length stats - Updated 2018-11-25
It looks like you have one point per unit of the x axis, instead of individual level data. How did you take the many individuals who fall into each bin and compress that into a single point?
Mean typically, for a day bucket.
It also would be neat to see the curve of best fit on the 1st and 3rd graphs, along with the confidence interval, using geom_smooth().
Took a while to figure out how to overlay them, but finally got it. Also got some major releases marked where appropriate. Updated in-place.
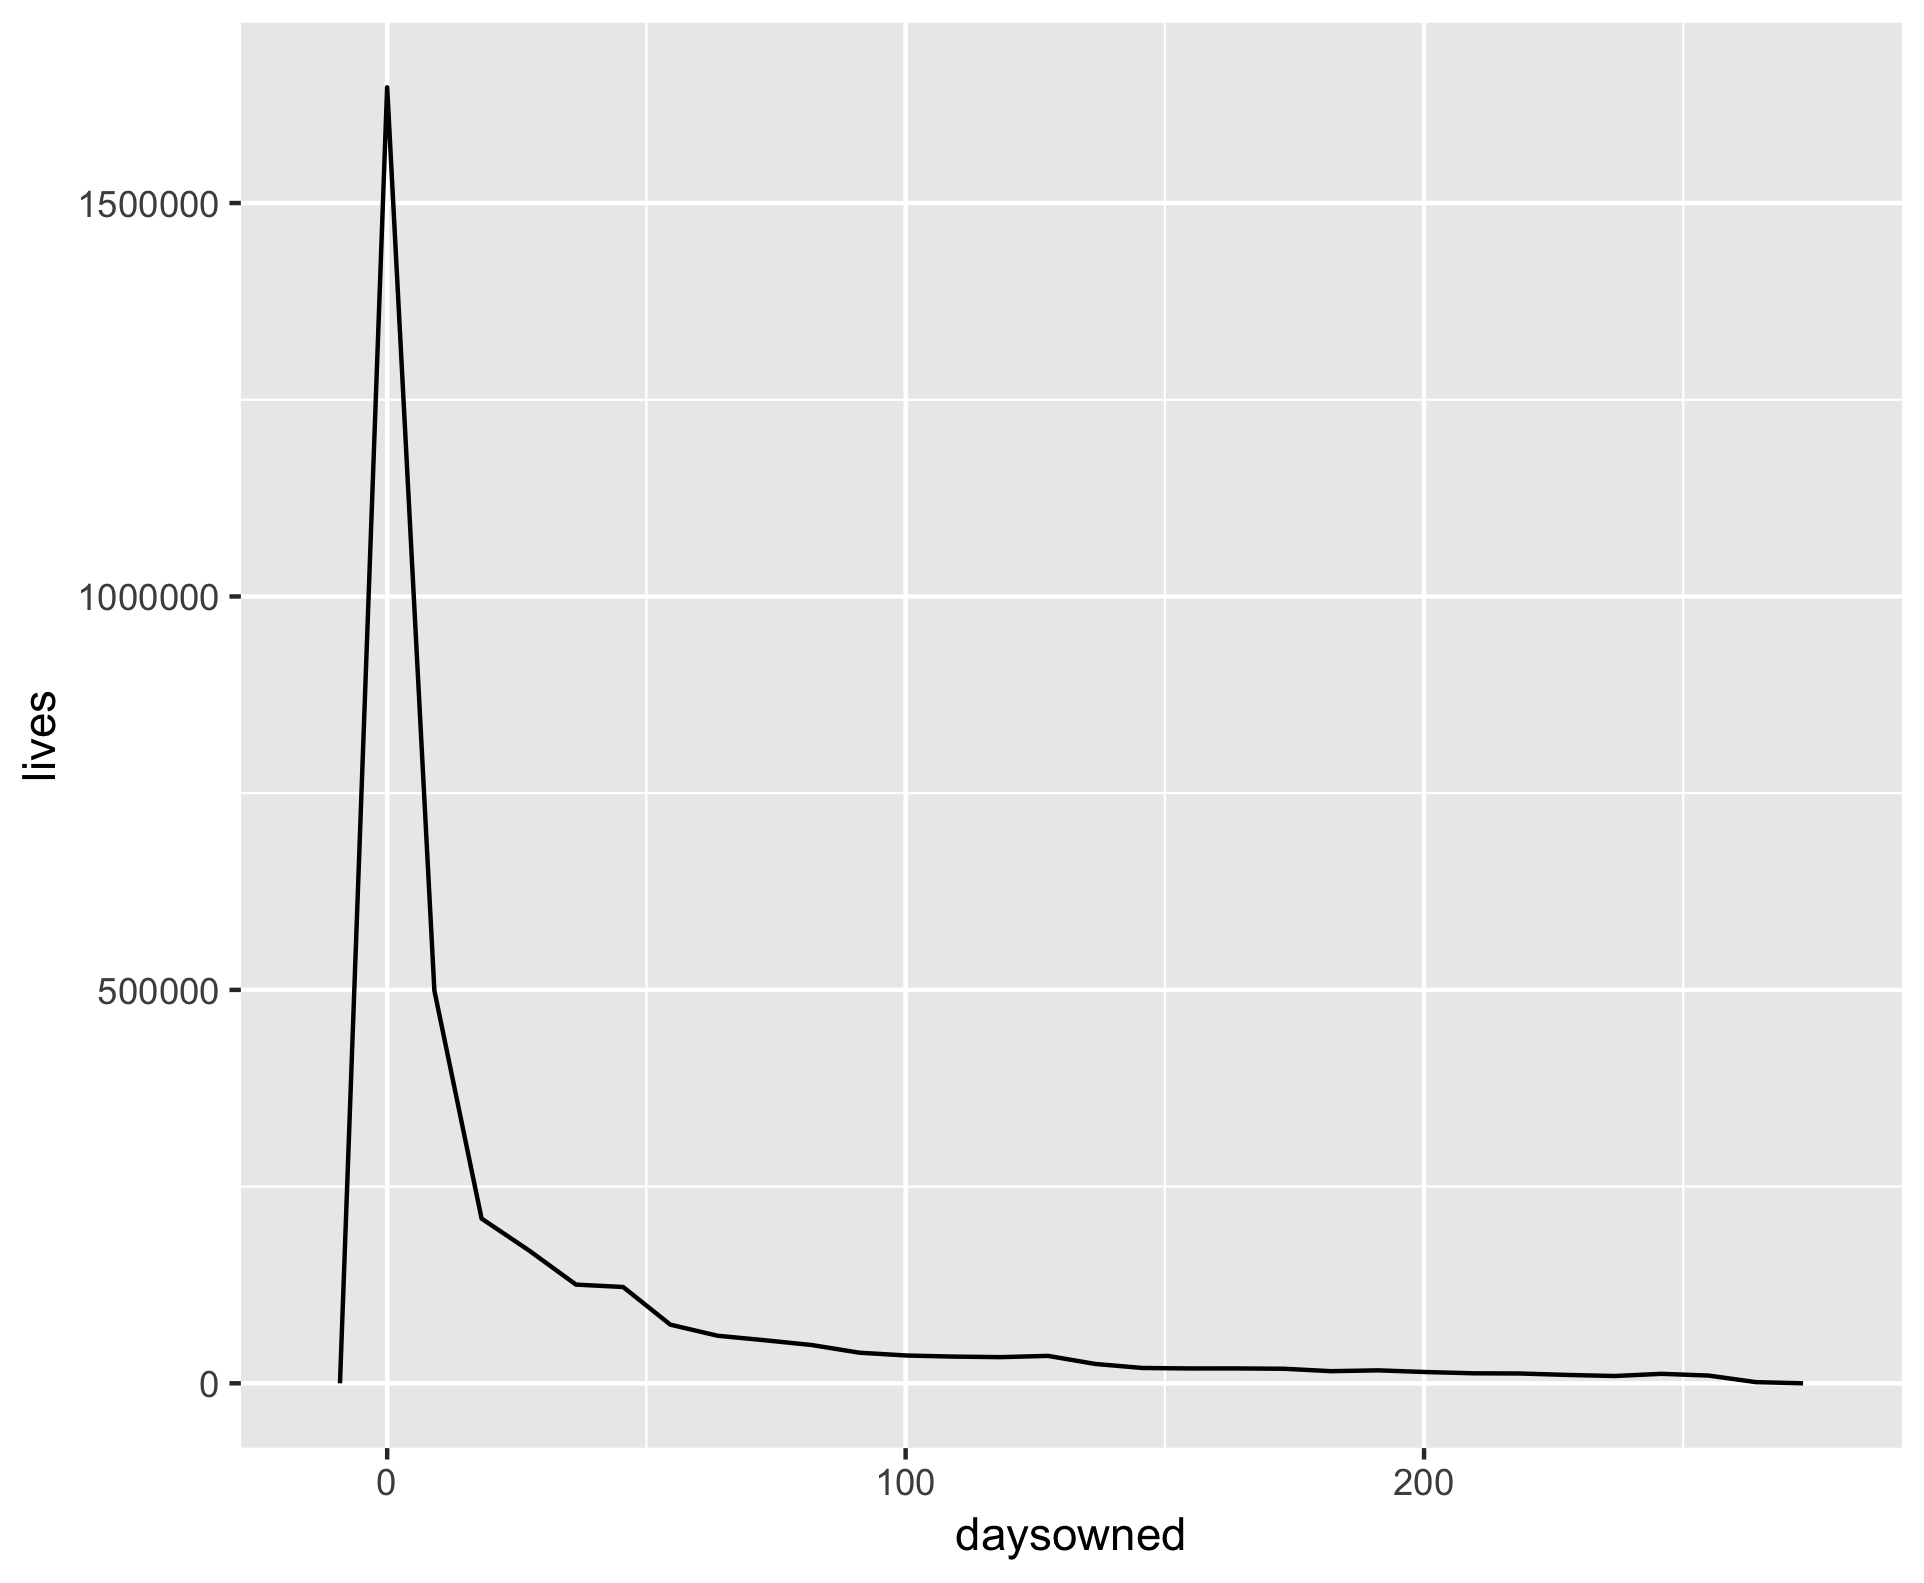
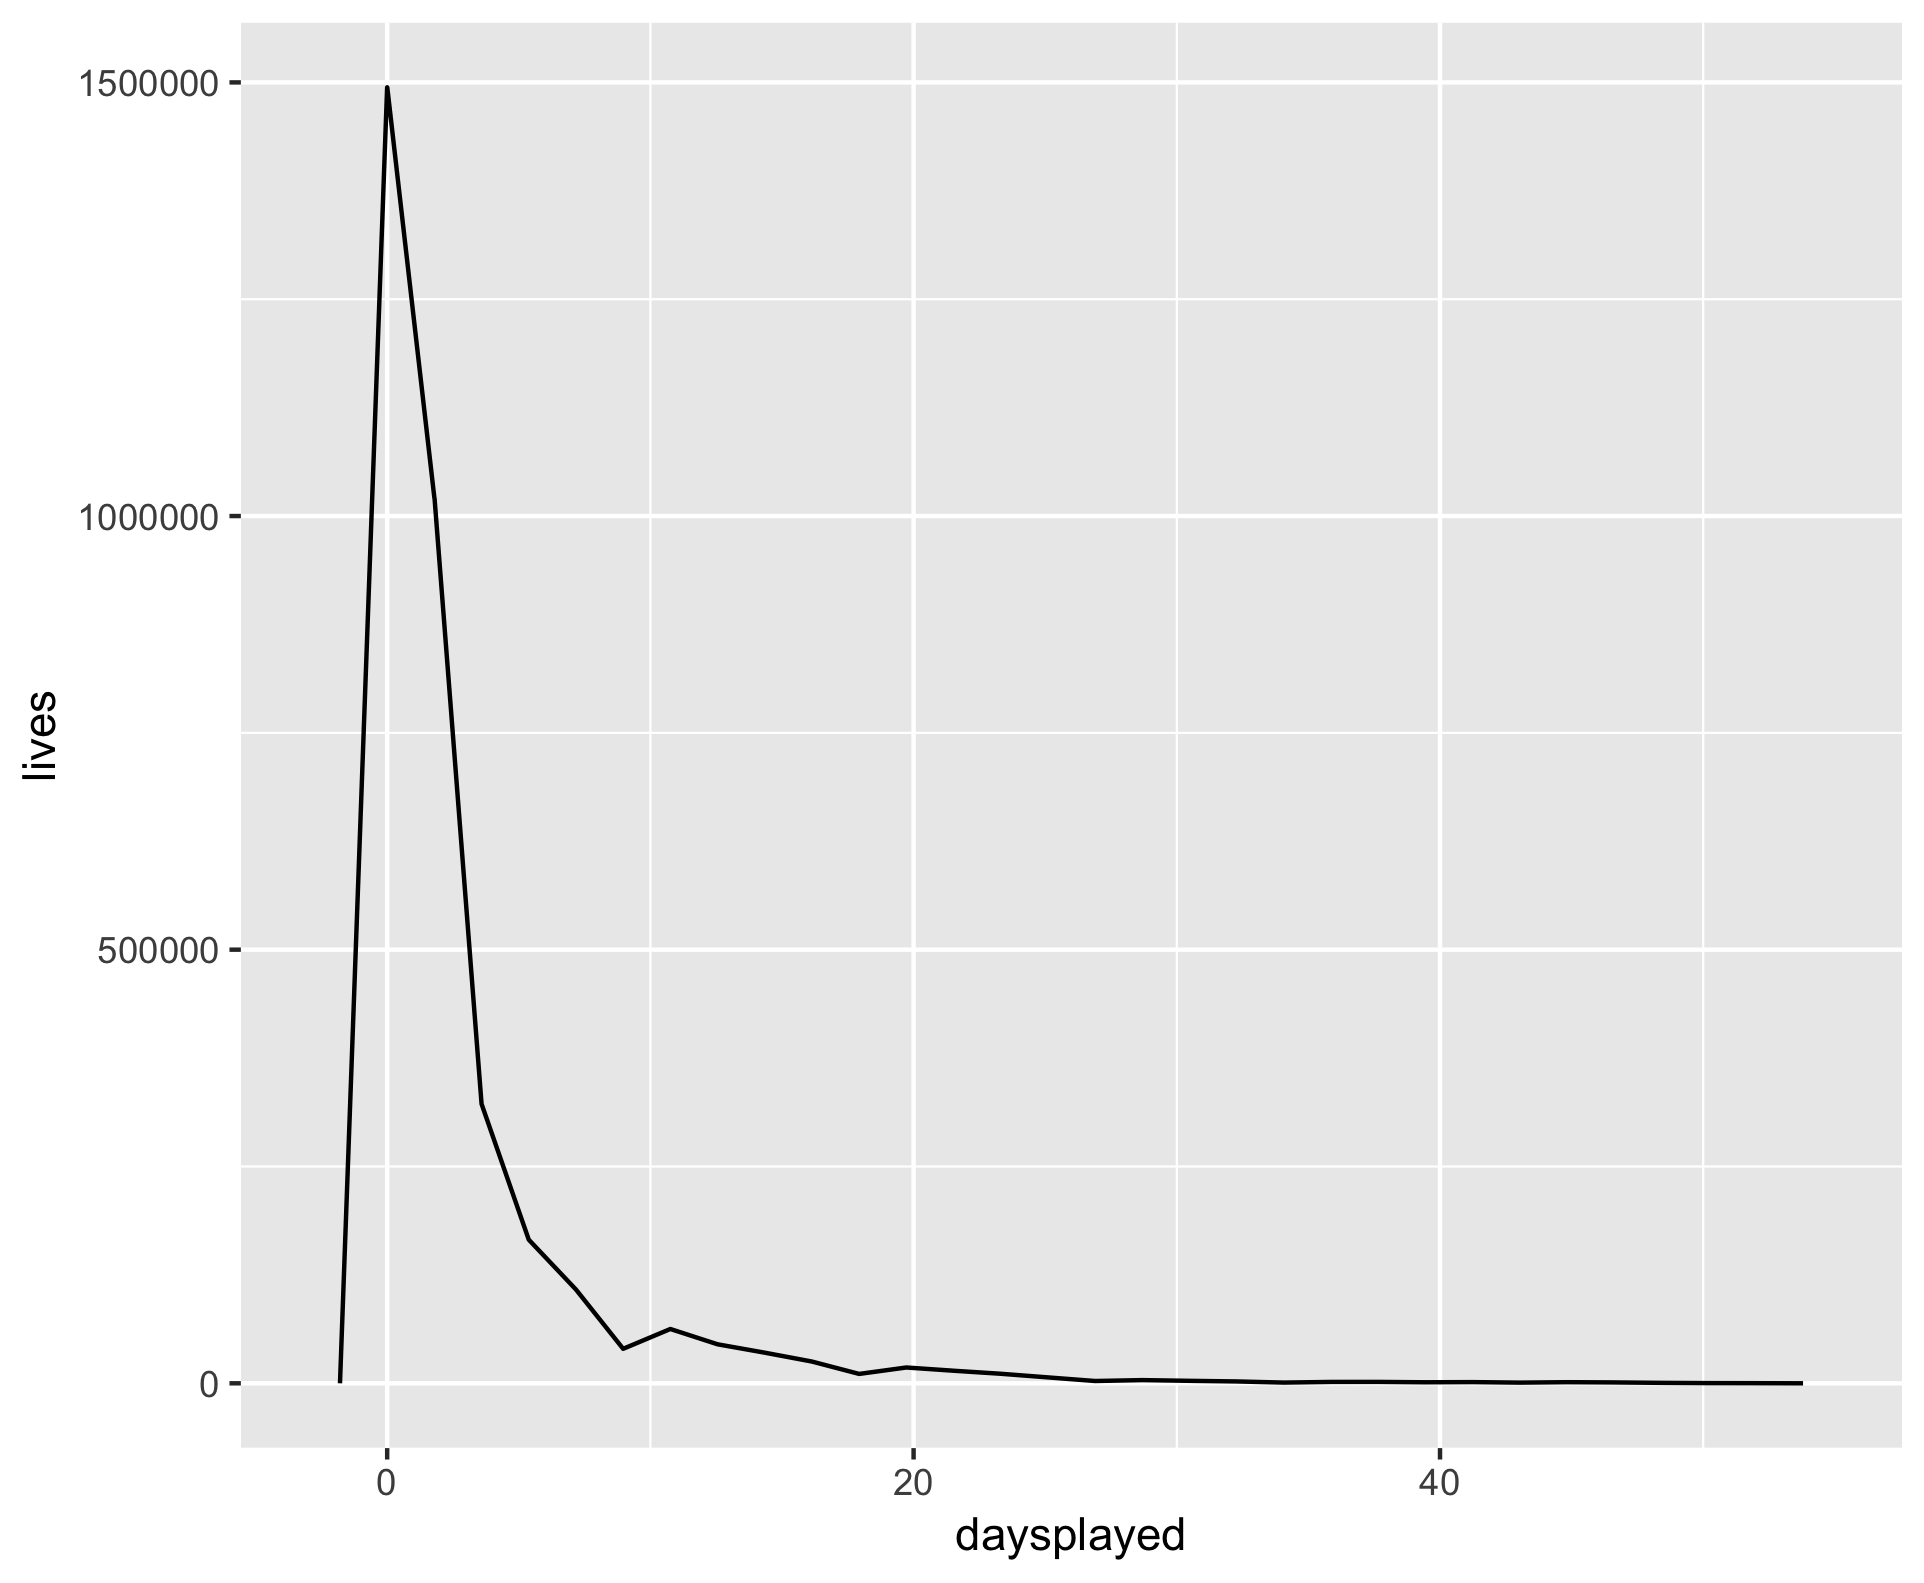
Also since the compression of information occurs, it might be interesting to see the density plot of the days owned and of days played.
About what I expected:
https://onemap.wondible.com/ -- https://wondible.com/ohol-family-trees/ -- https://wondible.com/ohol-name-picker/
Custom client with autorun, name completion, emotion keys, interaction keys, location slips, object search, camera pan, and more
Offline
#6 2018-11-25 16:37:49
- wondible
- Member
- Registered: 2018-04-19
- Posts: 855
Re: Player experience and life length stats - Updated 2018-11-25
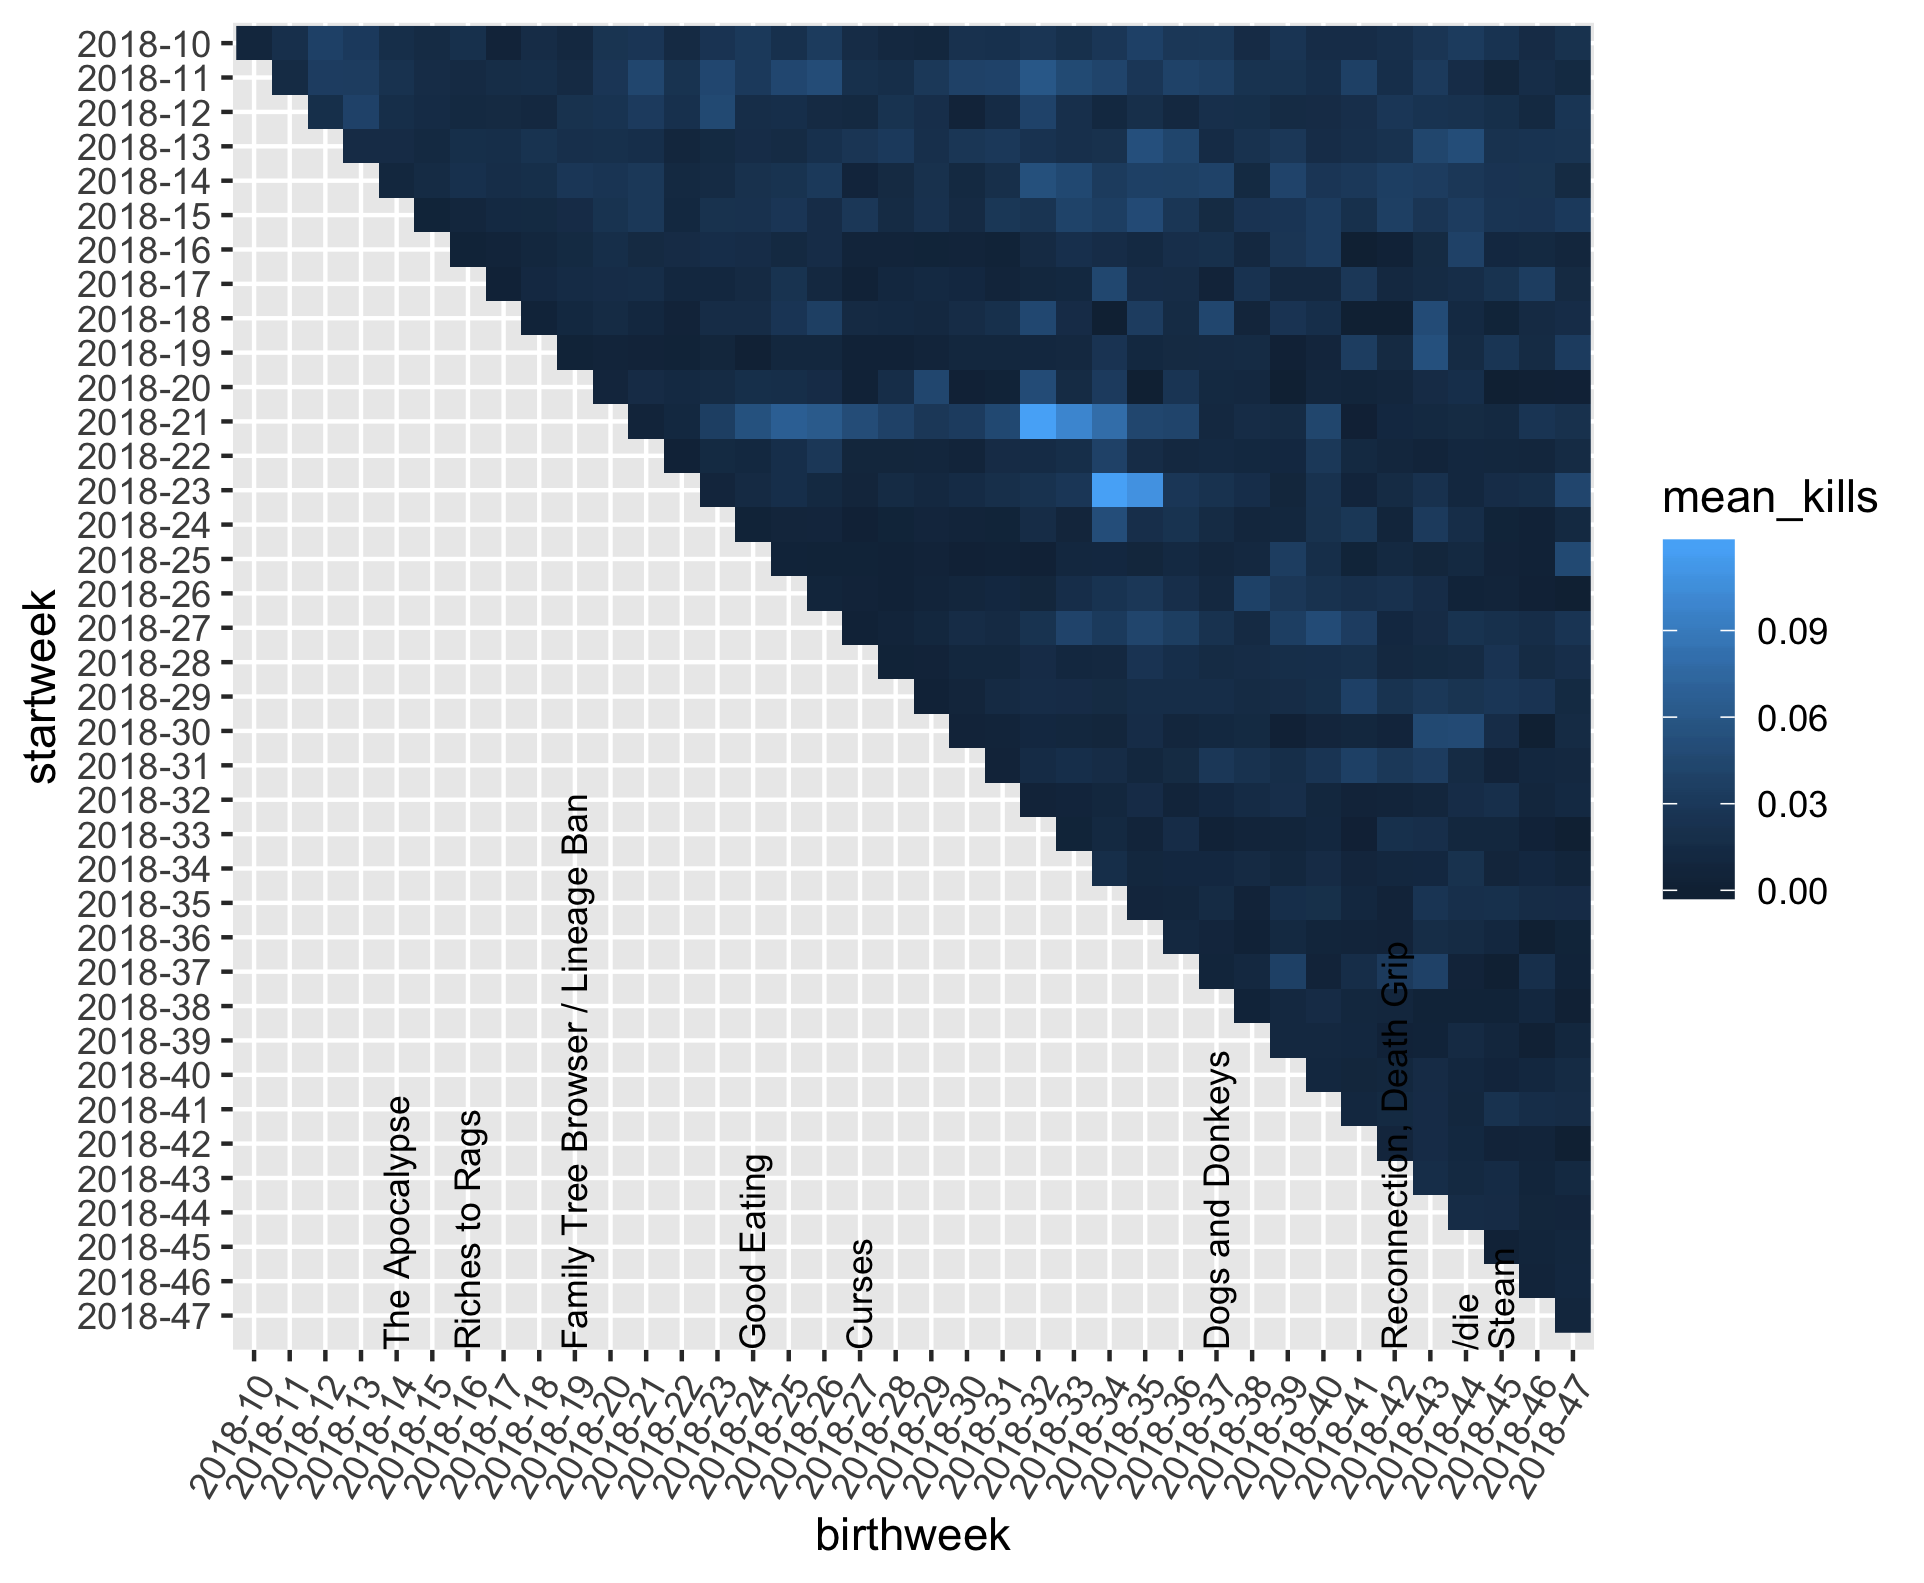
I also had time (while being a car passenger, mostly) to finally work out kill attribution. Just adding up kills is awkward because of changing player numbers, so I used average kills per life as a starting point.
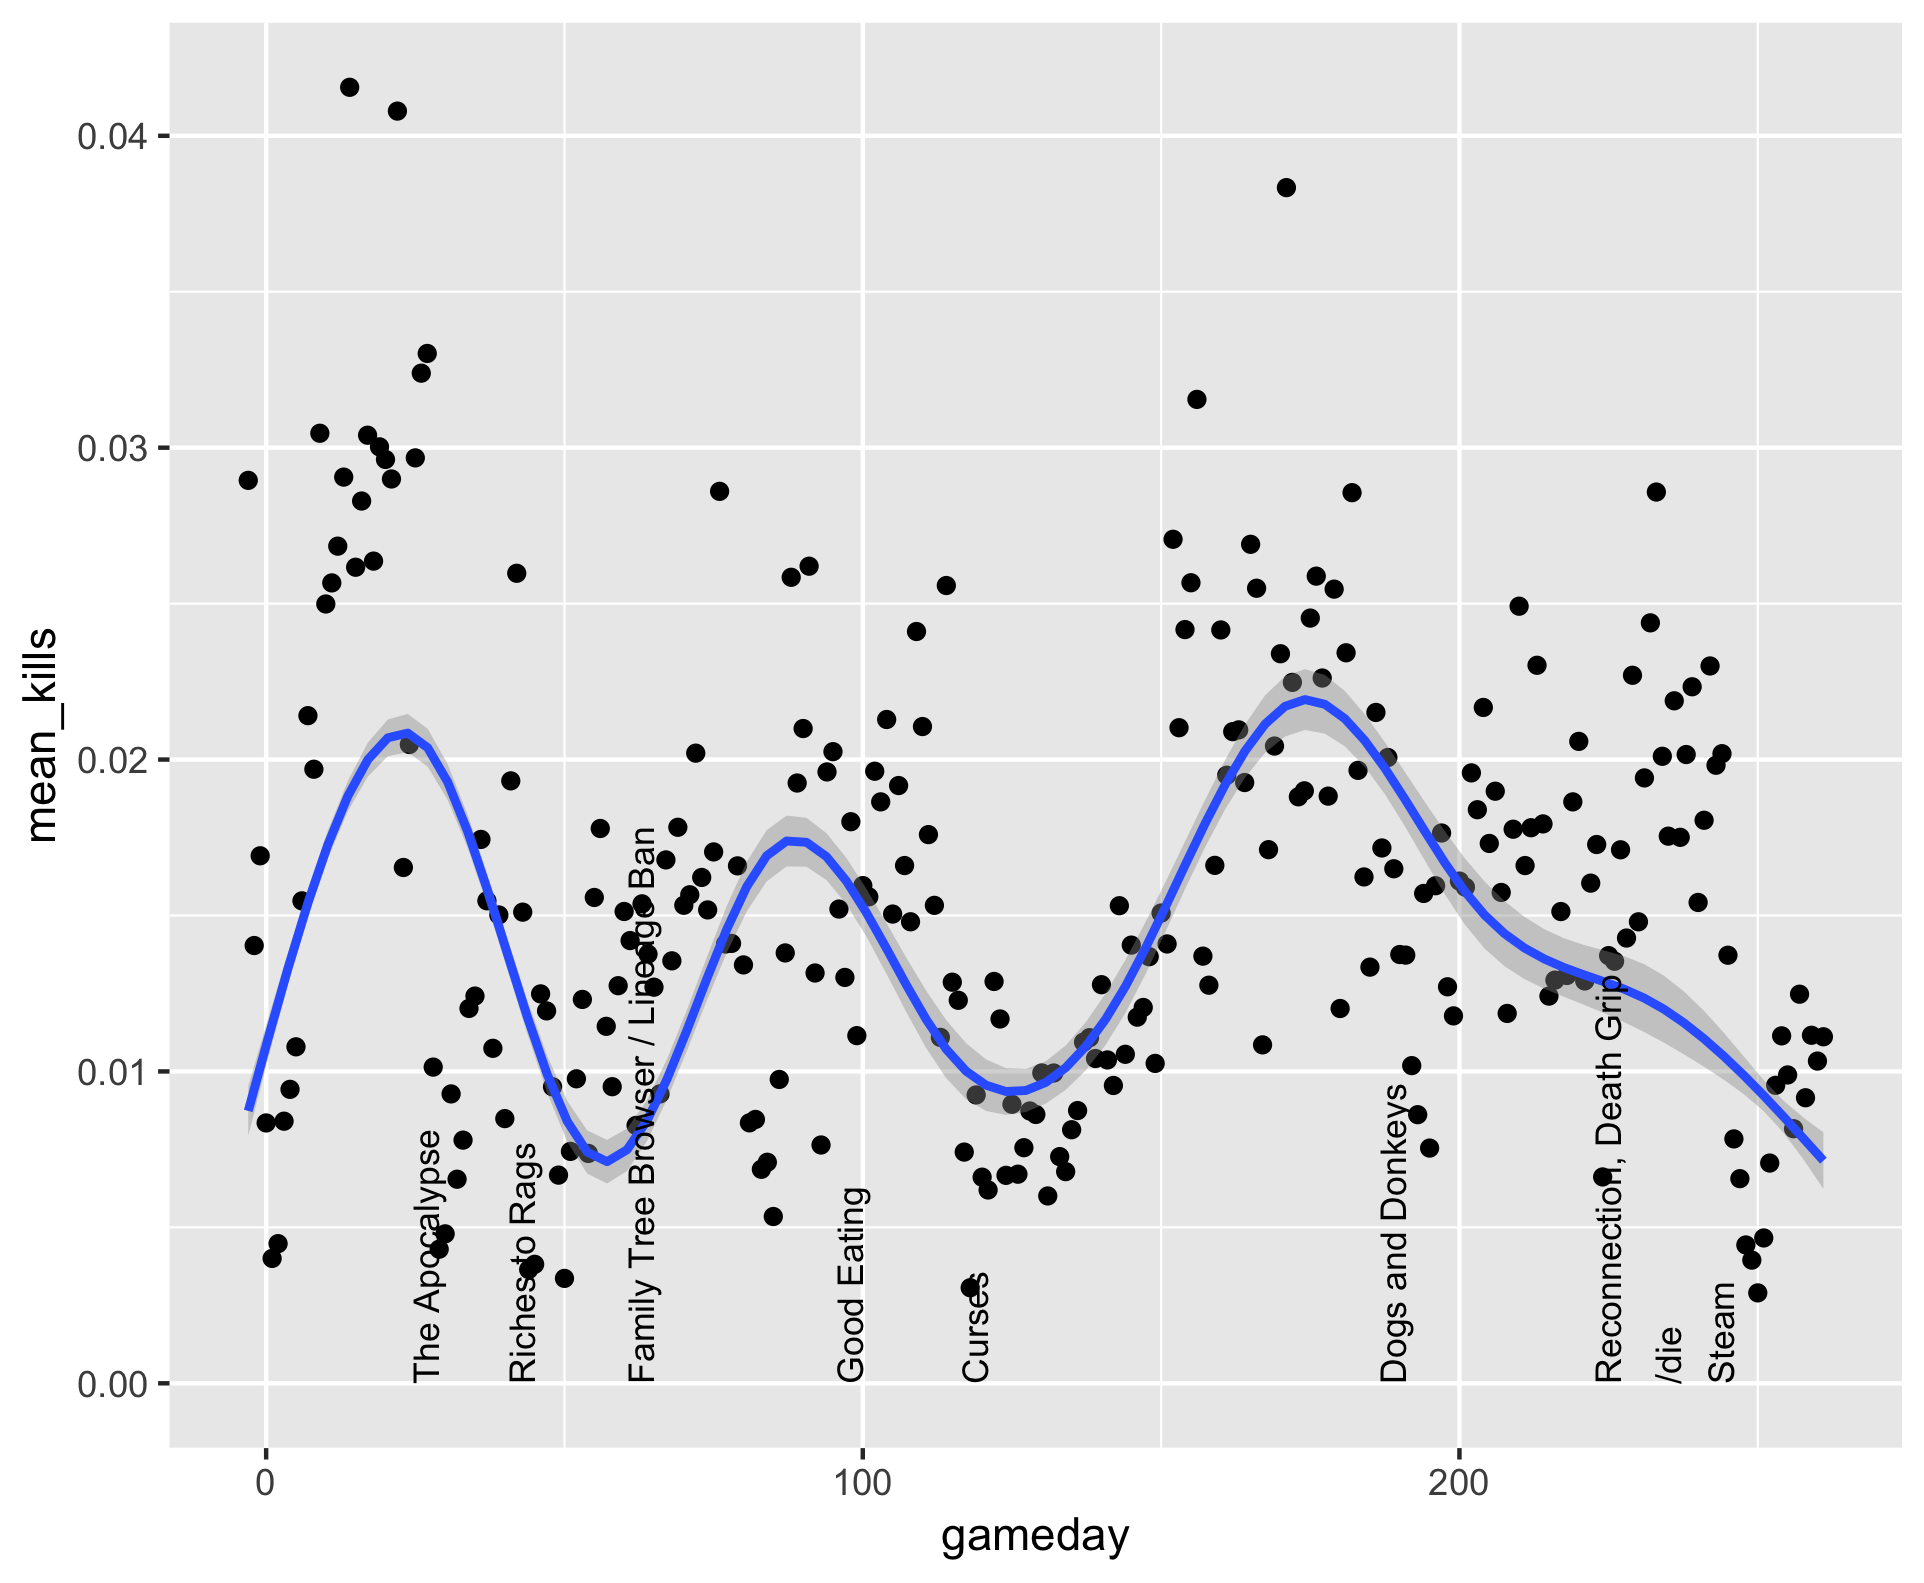
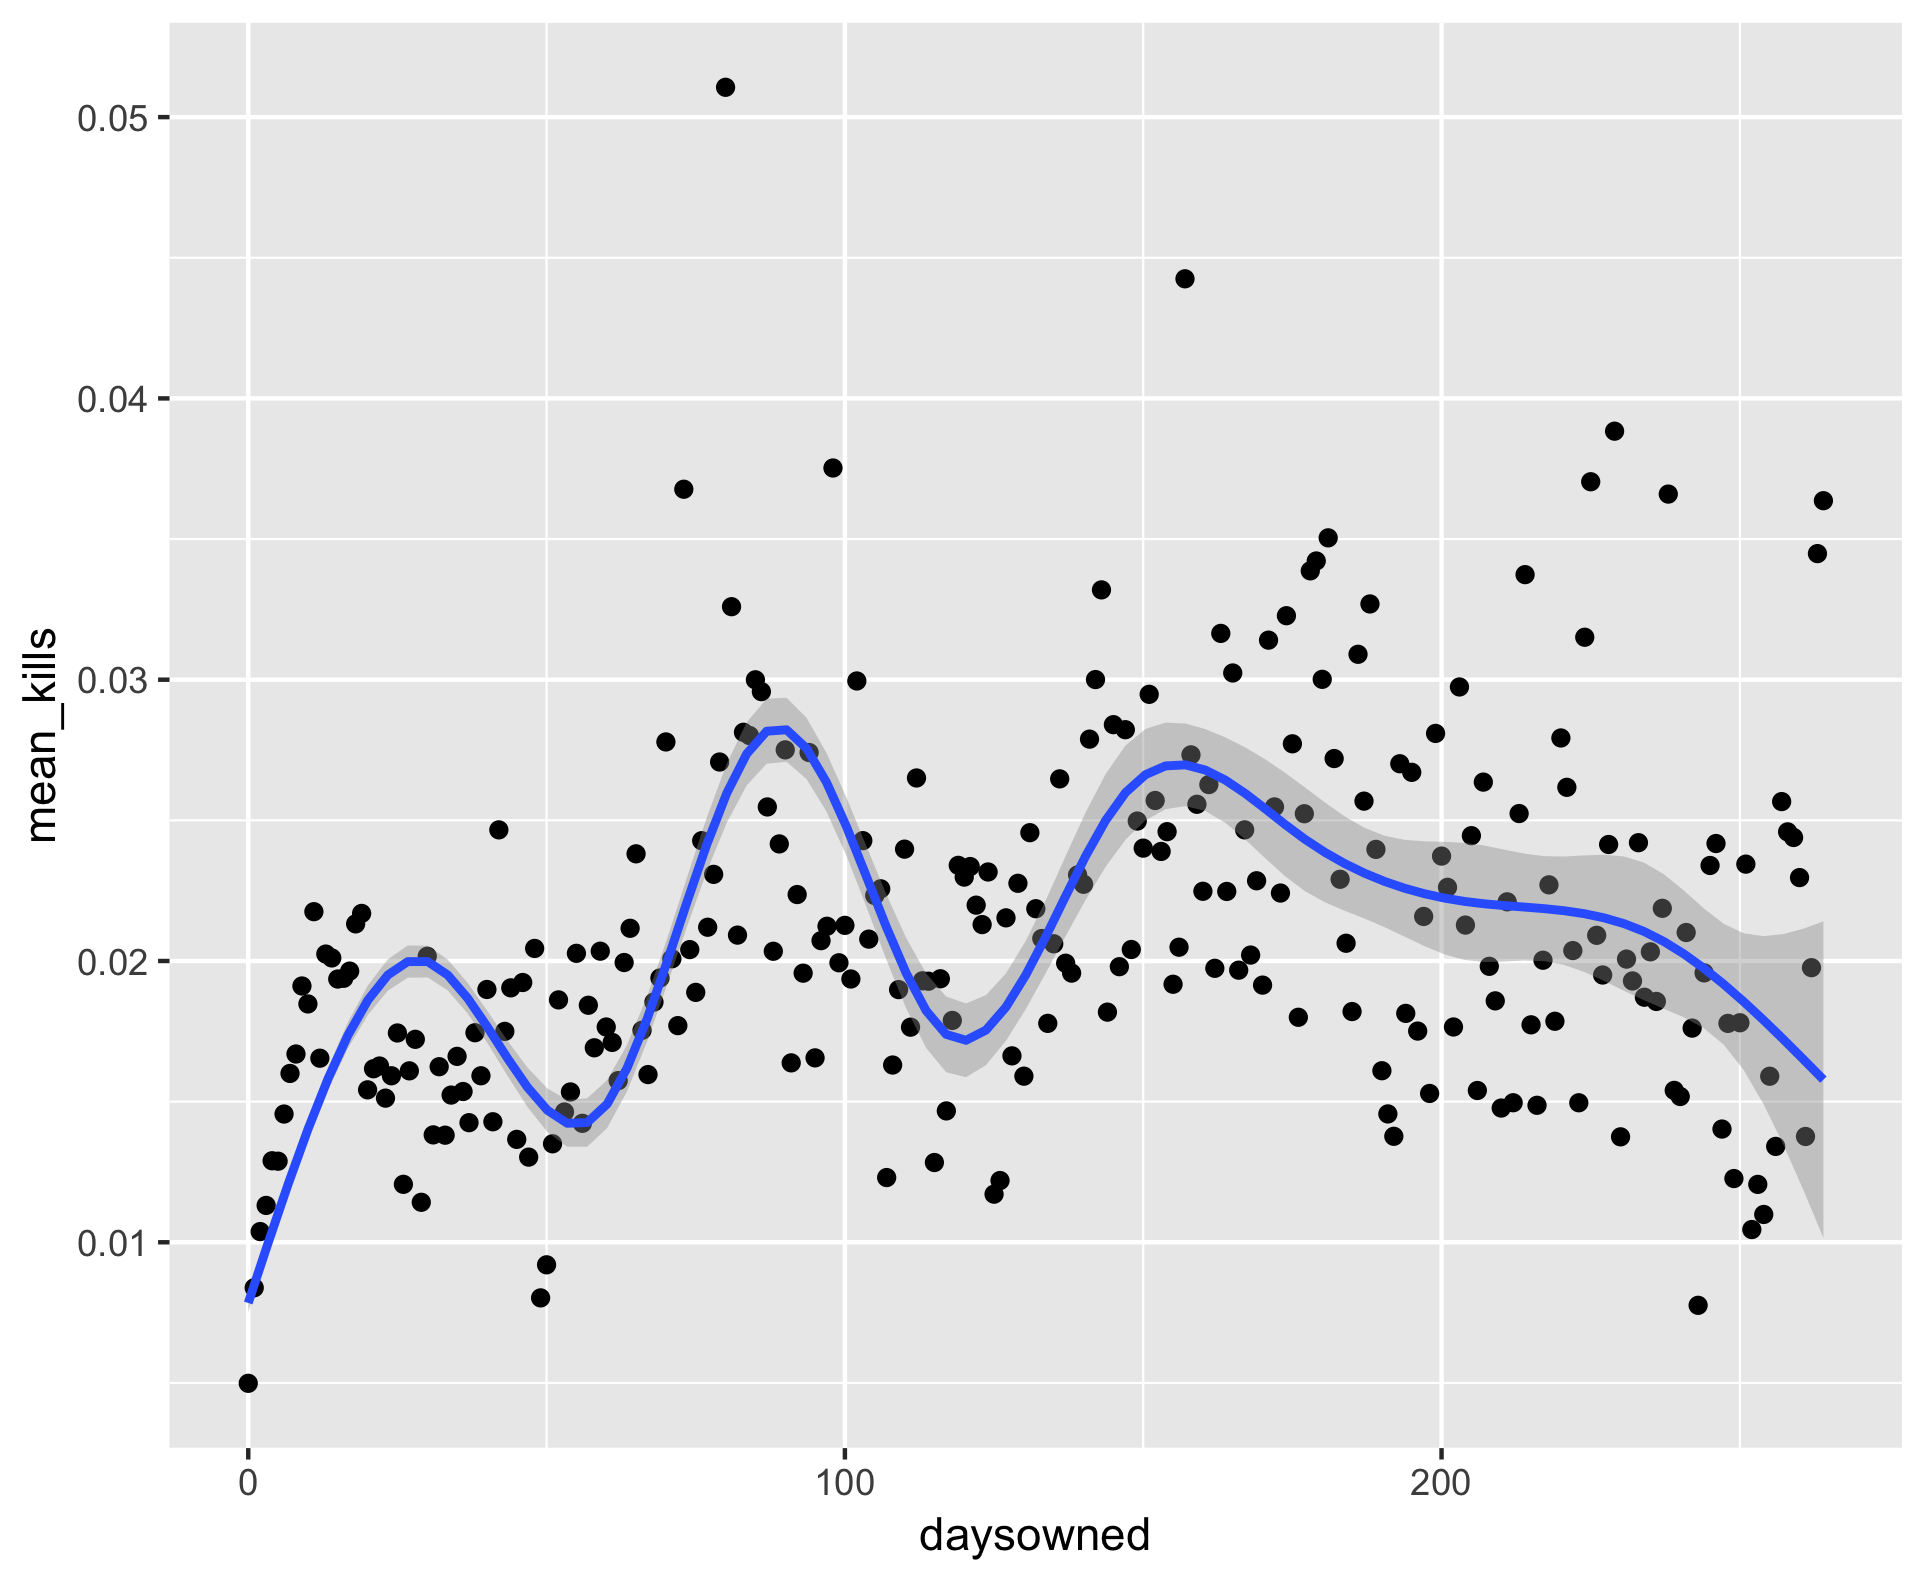
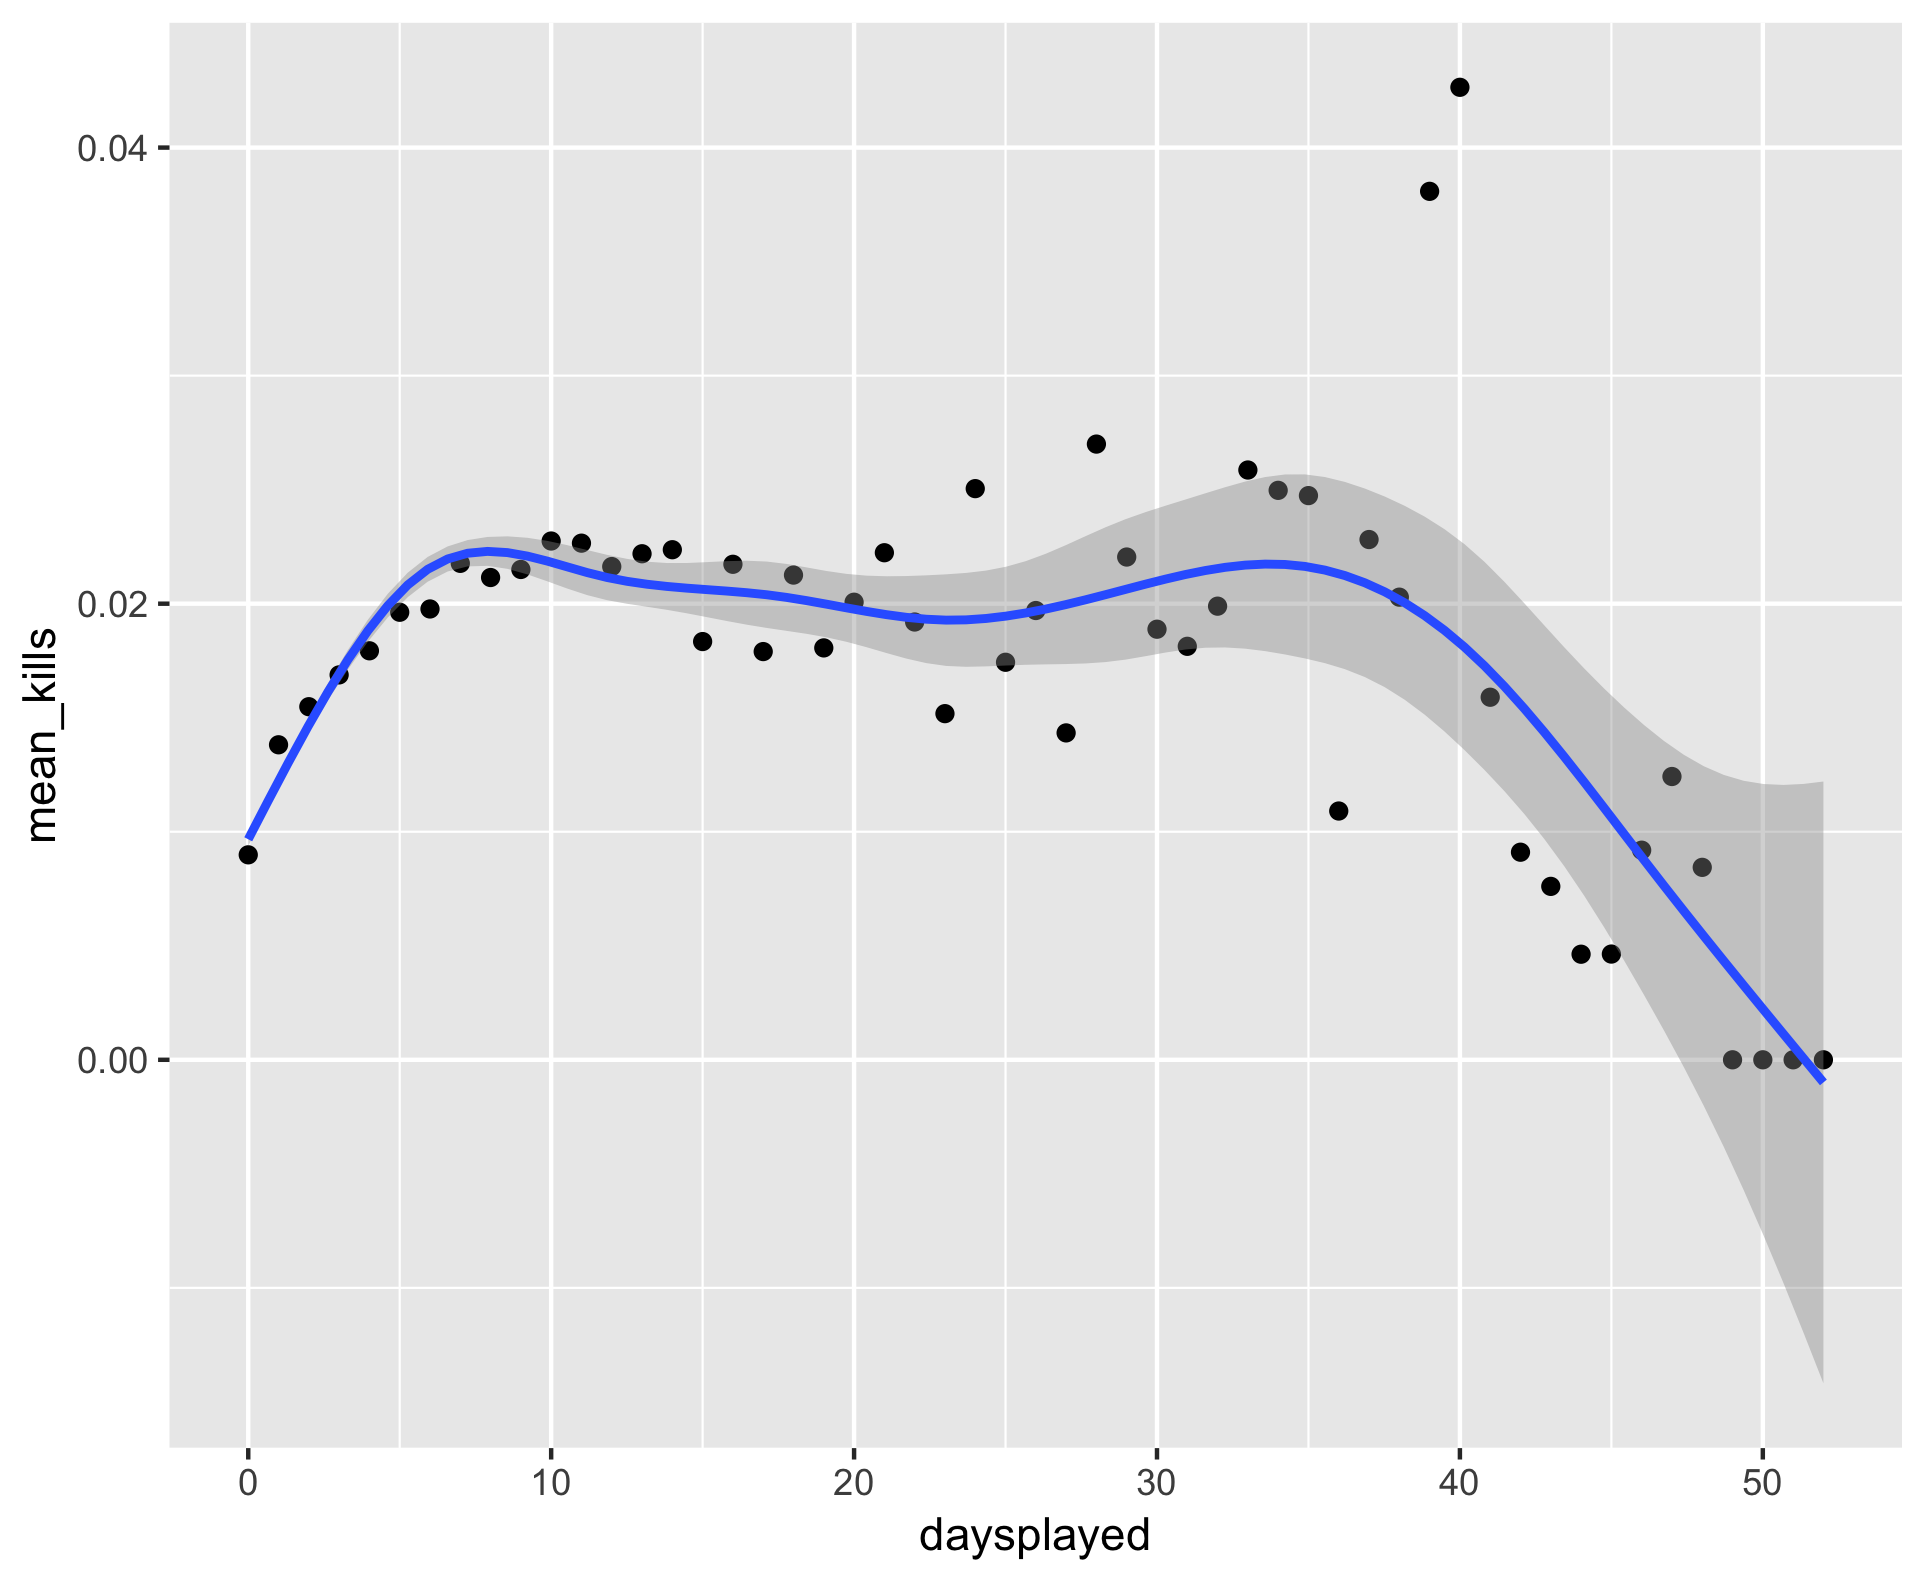
Horizontal trends in cohorts is probably one or two greifers, but I haven't tried to dig into it.
https://onemap.wondible.com/ -- https://wondible.com/ohol-family-trees/ -- https://wondible.com/ohol-name-picker/
Custom client with autorun, name completion, emotion keys, interaction keys, location slips, object search, camera pan, and more
Offline